Review
. 2013 Jul;40 Suppl 1(0 1):S60-71.
doi: 10.1007/s00259-013-2379-x. Epub 2013 Apr 3.

Metabolomic imaging of prostate cancer with magnetic resonance spectroscopy and mass spectrometry

Affiliations
Review

Metabolomic imaging of prostate cancer with magnetic resonance spectroscopy and mass spectrometry

Eva-Margarete Spur et al. Eur J Nucl Med Mol Imaging. 2013 Jul.

Abstract

Metabolomic imaging of prostate cancer (PCa) aims to improve in vivo imaging capability so that PCa tumors can be localized noninvasively to guide biopsy and evaluated for aggressiveness prior to prostatectomy, as well as to assess and monitor PCa growth in patients with asymptomatic PCa newly diagnosed by biopsy. Metabolomics studies global variations of metabolites with which malignancy conditions can be evaluated by profiling the entire measurable metabolome, instead of focusing only on certain metabolites or isolated metabolic pathways. At present, PCa metabolomics is mainly studied by magnetic resonance spectroscopy (MRS) and mass spectrometry (MS). With MRS imaging, the anatomic image, obtained from magnetic resonance imaging, is mapped with values of disease condition-specific metabolomic profiles calculated from MRS of each location. For example, imaging of removed whole prostates has demonstrated the ability of metabolomic profiles to differentiate cancerous foci from histologically benign regions. Additionally, MS metabolomic imaging of prostate biopsies has uncovered metabolomic expression patterns that could discriminate between PCa and benign tissue. Metabolomic imaging offers the potential to identify cancer lesions to guide prostate biopsy and evaluate PCa aggressiveness noninvasively in vivo, or ex vivo to increase the power of pathology analysis. Potentially, this imaging ability could be applied not only to PCa, but also to different tissues and organs to evaluate other human malignancies and metabolic diseases.


Conflict of interest statement

Competing Interests: None

Figures

Figure 1
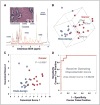
Figure 1. Metabolomic profiles of human PCa from HRMAS proton MRS
(A) high-resolution magic angle spinning 1H MR spectrum of intact tissue obtained from the removed prostate of a 61-year-old patient with GS 6 T2b tumors. Histopathology analysis of the tissue sample (insert) after its spectroscopy measurement revealed that the sample contained 40% histopathologically defined benign epithelium and 60% stromal structures, with no identifiable cancerous glands. Cellular metabolites mentioned in the text are labeled on the spectrum. The 36 most intense resonance peaks or metabolite groups above the horizontal bars were selected for analyses, whereas the other regions were excluded from calculation, partly due to surgery-related alcohol contamination. (B) three-dimensional plot of principal component 13 (PC13 correlates linearly with percent volume of cancer cells in tissue samples) versus phosphocholine versus choline. Cancerous and histologically benign (histo-benign) tissue samples from 13 patients can be visually separated in observation plane. The paired Student’s t test results (cancer versus histo-benign from the same patients) for principal component 13, phosphocholine, and choline are 0.012, 0.004, and 0.001. Only results from these 13 patients could be evaluated with paired tests for other cancer positive samples were collected from patients from whom no histo-benign samples were analyzed. (C) the canonical plot resulting from discriminant analysis of the three variables in B presents the maximum separation between the two groups. (D) the resulting receiver operating characteristic curves indicates the accuracy of using the three variables in B to positively identify cancer samples.(Figure adapted with permission from Cheng et al. 2005, Figure 1)
Figure 2
Figure 2. Principal components 2 and 5 as predictors of tumor stage
Principal component 2 (A) can differentiate T2c stage tumors from T2ab and T3 tumors, whereas principal component 5 (B) can differentiate T2ab from T2c and T3 stages, as defined by AJCC/TNM staging system with histo-benign samples, and with histo-benign GS 6 and 7 samples (C and D). In the latter, principal components 2 and 5 can differentiate among three tumor groups: GS 6 T2ab, GS 6 T2c, and GS 6 T3 plus GS 7 tumors. (Figure adapted with permission from Cheng et al. 2005, Figure 3)
Figure 3
Figure 3. Metabolomic alterations of PCa progression
(a) Heat map showing 87 differential metabolites in PCA relative to benign samples (Wilcoxon P ≤ 0.05). Localized PCA samples are grouped as i., low grade (Gleason < 6) and ii., high grade (Gleason > = 7). Metastatic samples are grouped by the site of tissue procurement namely iii., soft tissue, iv., rib/diaphragm or v., liver. (b) Benign-based z-score plot of named metabolites from (a). Each point represents one metabolite in one sample, colored by tissue type (jade = benign, yellow = PCA). (c) As in (b) except for the comparison between Mets (red) and PCA (yellow), with data represented relative to the mean of the PCA samples. For clarity, the plots in (b) and (c) have been truncated at 15 standard deviations above the mean of the benign and PCA samples, respectively. (Figure adapted with permission from Sreekumar et al. 2005, Figure 2)
Figure 4
Figure 4. The 3D metabolite mapping in a patient with a brain tumor at 3 Tesla
T2-weighted MRI, metabolite maps and water reference scan demonstrate spatial heterogeneity of the lesion. Data were acquired in 10 min including water reference scan using 32 × 32 × 8 spatial matrix and 7 mm isotropic voxel dimensions (0.34 cc voxel size). (Figure adapted with permission from Posse et al. 2012, Figure 10)
Figure 5
Figure 5. Data from MRSI and MRI of prostate directly aligned and overlaid
(a) A T2-weighted FSE axial image taken from a volume data set demonstrating a large tumor in the right midgland to base. The selected volume for spectroscopy (bold white box) and a portion of the 16 × 8 × 8 spectral phase-encode grid from one of eight axial spectroscopic slices is shown overlaid (fine white line) on the T2-weighted image. Spectra in (d, red box) regions of cancer demonstrate dramatically elevated choline, and a reduction or absence of citrate and polyamines relative to (c, green box) regions of healthy peripheral zone tissue. In this fashion, metabolic abnormalities can be correlated with anatomic abnormalities from throughout the prostate. The strength of the combined MRI/ MRSI exam is demonstrated when changes in all three metabolic markers (choline, polyamines, and citrate) and imaging findings are concordant for cancer. (Figure adapted with permission from Kurhanewicz et al. 2002, Figure 2)
Figure 6
Figure 6. Metabolomic imaging of cancer from excised human prostate
(A) MRI of a prostate axial cross section (from a 47-year-old TNM stage pT2cNxMx patient) overlaid with a grid to indicate the locations of 16 × 16 voxels for which multivoxel MR spectra were acquired. The outer white border delineates the outline of the prostate cross section; the inner white border circles the urethra. Spectra in voxels outside the outer border and inside the inner border were not included in the analyses. (B) Because of the magnetic susceptibility interference at the tissue-air interface, spectra in voxels between solid and dashed lines were eliminated from further analysis. The values of the metabolomic profile for the remaining voxels were calculated for all remaining voxels; the values were then mapped onto the MR image with a color range calibrated to -100 and 100. (C) Histologically identified cancer regions are circled in red and plotted onto a whole mount prostate histology image at approximately the same prostate cross-sectional level as in (B). Metabolomic profile regions having at least two connected voxels with profile values greater than M+SD are plotted in shaded red. Partial tumor sizes are estimated by excluding their overlaps with purple voxels; here, the “partial tumor size” for the right lesion on the top right of the histological slide equals the total tumor size, whereas for the cancer region on the top left of the histological slide it is less than half the tumor size. Geometrical centers are used to calculate the center of profile-elevated regions and to estimate the center of partial tumor size, excluding the discarded voxels. (D) Representative spectra from voxels with elevated [a in (B)] and nonelevated [b in (B)] profile values are plotted. (Figure adapted with permission from Wu et al. 2010, Figure 3)
Figure 7
Figure 7. Correlations of metabolomic profiles with histology
(A) The malignancy index provides a threshold indication of malignant potential for profile-elevated regions with and without histologically identifiable cancer (P < 0.008, for all tumors; P < 0.004, for T2 tumors); overall accuracies are presented by the ROC curves (B) for all tumors and for T2 tumors only. AUC, area under curve. (Figure adapted with permission from Wu et al. 2010, Figure 4)
Figure 8
Figure 8. Direct tissue mass spectrometric analysis of human prostate tissue reveals cell-specific profiles
Frozen prostate tissue was subjected to MALDI-IMS. MALDI-IMS of a single prostate tissue containing tumor and uninvolved regions. (a) H&E image of a tissue specimen containing a defined area of PCa glands and benign glands. Insets, magnified (× 10) views of each cell type. (b) resulting two-dimensional ion density map showing high expression of a peak at m/z 4,355 (red) in the PCa area (inset is a scan of the tissue after matrix deposition). (Figure adapted with permission from Cazares et al. 2009, Figure 1)

References

    1. NCI. Defeating Prostate Cancer: Crucial Directions for Research, Report of the Prostate Cancer Progress Review Group. 1998. - PubMed
    1. Siegel R, Naishadham D, Jemal A. Cancer statistics, 2012. CA Cancer J Clin. 2012;62:10–29. - PubMed
    1. Andriole GL, Crawford ED, Grubb RL, 3rd, Buys SS, Chia D, Church TR, Fouad MN, Gelmann EP, Kvale PA, Reding DJ, Weissfeld JL, Yokochi LA, O’Brien B, Clapp JD, Rathmell JM, Riley TL, Hayes RB, Kramer BS, Izmirlian G, Miller AB, Pinsky PF, Prorok PC, Gohagan JK, Berg CD. Mortality results from a randomized prostate-cancer screening trial. N Engl J Med. 2009;360:1310–9. - PMC - PubMed
    1. Welch HG, Albertsen PC. Prostate cancer diagnosis and treatment after the introduction of prostate-specific antigen screening: 1986–2005. J Natl Cancer Inst. 2009;101:1325–9. - PMC - PubMed
    1. Brawer MK. Prostate-specific antigen: current status. CA Cancer J Clin. 1999;49:264–81. - PubMed

Publication types

LinkOut - more resources