. 2013 Jul;12(7):1900-11.
doi: 10.1074/mcp.M112.025783. Epub 2013 Apr 2.

Integrative omics analysis reveals the importance and scope of translational repression in microRNA-mediated regulation

Affiliations

Integrative omics analysis reveals the importance and scope of translational repression in microRNA-mediated regulation

Qi Liu et al. Mol Cell Proteomics. 2013 Jul.

Abstract

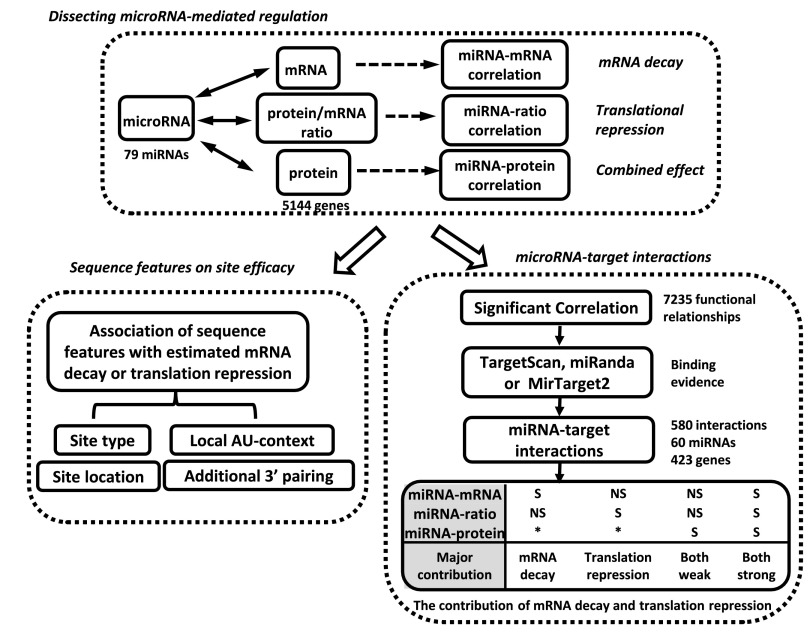
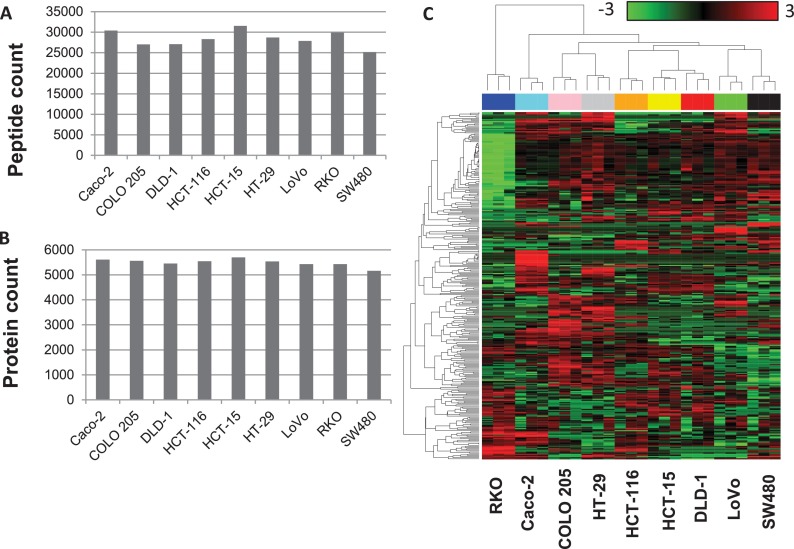
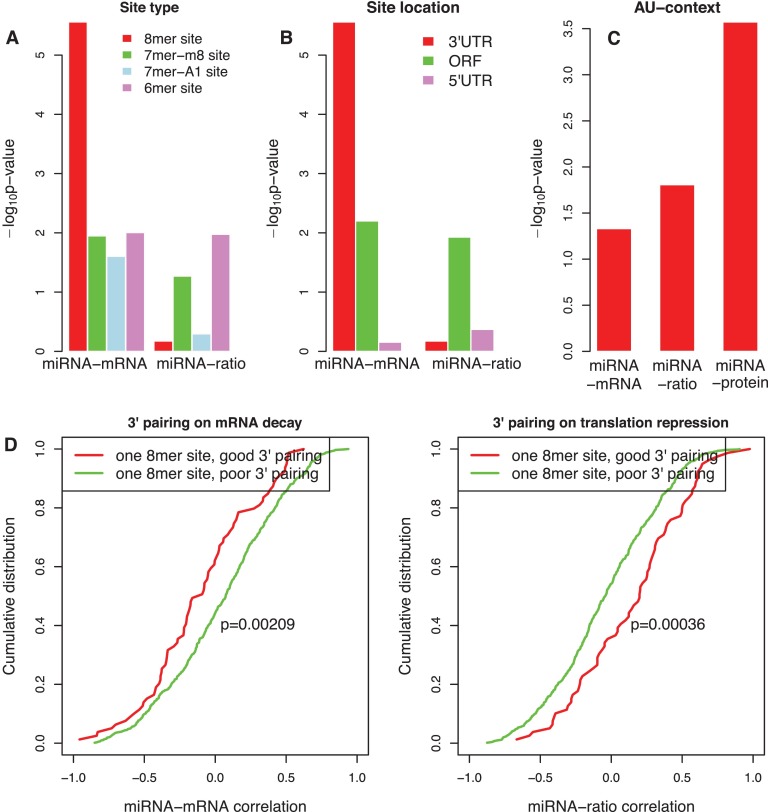
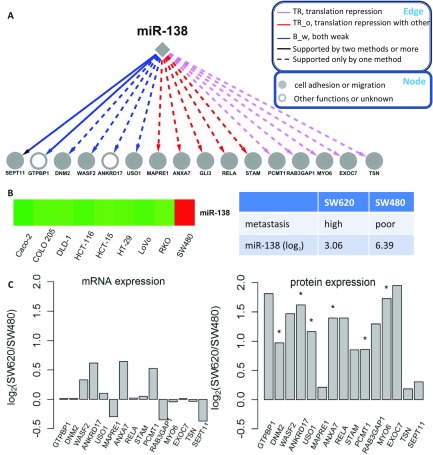
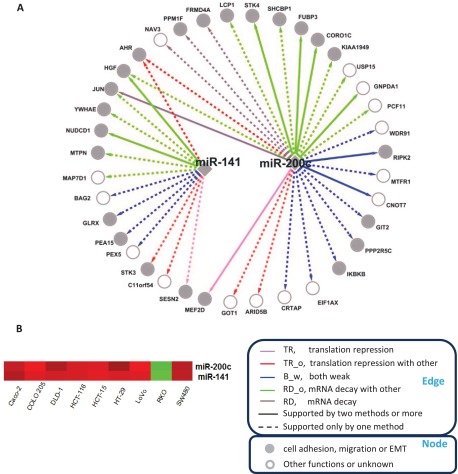
MicroRNAs (miRNAs) are key post-transcriptional regulators that inhibit gene expression by promoting mRNA decay and/or suppressing translation. However, the relative contributions of these two mechanisms to gene repression remain controversial. Early studies favor a translational repression-centric scenario, whereas recent large-scale studies suggest a dominant role of mRNA decay in miRNA regulation. Here we generated proteomics data for nine colorectal cancer cell lines and integrated them with matched miRNA and mRNA expression data to infer and characterize miRNA-mediated regulation. Consistent with previous reports, we found that 8mer site, site positioning within 3'UTR, local AU-rich context, and additional 3' pairing could all help boost miRNA-mediated mRNA decay. However, these sequence features were generally not correlated with increased translational repression, except for local AU-rich context. Thus the contribution of translational repression might be underestimated in recent studies in which the analyses were based primarily on the response of genes with canonical 7-8 mer sites in 3'UTRs. Indeed, we found that translational repression was involved in more than half, and played a major role in one-third of all predicted miRNA-target interactions. It was even the predominant contributor to miR-138 mediated regulation, which was further supported by the observation that differential expression of miR-138 in two genetically matched cell lines corresponded to altered protein but not mRNA abundance of most target genes. In addition, our study also provided interesting insights into colon cancer biology such as the possible contributions of miR-138 and miR-141/miR-200c in inducing specific phenotypes of SW480 and RKO cell lines, respectively.


Figures

Fig. 1.
Fig. 1.
Overview of the integrative omics analysis. We calculated three types of correlations between miRNA and genes: miRNA-mRNA, miRNA-protein, and miRNA-ratio. Using the strength of miRNA-mRNA and miRNA-ratio correlations, we estimated the effect of four features on site efficacy in mRNA decay and translational repression, respectively. Meanwhile, we combined functional evidence from the three types of significant inverse correlations (miRNA-mRNA, miRNA-protein, or miRNA-ratio) and binding evidence from sequence-based prediction tools to identify miRNA-target interactions. Finally we classified these interactions into different categories based on the type of supporting correlation and inferred the major contributor (mRNA decay or translational repression) to miRNA-mediated regulation in each category (S: significant; NS: nonsignificant; *: S or NS).
Fig. 2.
Fig. 2.
Shotgun proteomics provided robust global profiles of cellular proteomes. A, Number of peptides identified for each cell line. B, Number of proteins identified for each cell line. C, Unsupervised clustering indicated high reproducibility of the profiles. The heat map was created based on the top 5% of proteins with the highest variation across all 27 experiments. Each row represents a protein and each column represents an experiment. Samples are color-coded on the top by cell line and labeled at the bottom. The color scale bar shows the relative protein expression level (0 is the average expression level of a given protein in all samples).
Fig. 3.
Fig. 3.
Sequence features affecting the efficacy of mRNA decay and translational repression. A, Efficacy of different target site types. Plotted are p values calculated by one-sided KS-test for comparing the cumulative distribution of miRNA-mRNA and miRNA-ratio correlation between miRNAs and genes with different target site types with those between miRNAs and genes with no site. B, Efficacy of sites located in 3′UTR, ORF or 5′UTR. Plotted are p values calculated by one-sided KS-test for comparing the cumulative distribution of miRNA-mRNA and miRNA-ratio correlation between miRNAs and genes with 8mer sites located in different gene regions with those between miRNAs and genes with no site. C, Efficacy of local AU-content. Plotted are p values calculated by one-sided KS-test for comparing the cumulative distribution of miRNA-mRNA, miRNA-ratio, and miRNA-protein correlation between miRNAs and genes with a high AU-content site (top quartile) with those between miRNAs and genes with a low AU-content site (bottom quartile). D, Efficacy of additional 3′ pairing. Plotted are the cumulative distribution of miRNA-mRNA and miRNA-ratio correlation between miRNAs and genes containing one 8mer site with good 3′ pairing (red) and that between miRNAs and genes with poor 3′ pairing (green) (p = 0.00209 for miRNA-mRNA, p = 0.00036 for miRNA-ratio, one-sided K-S test).
Fig. 4.
Fig. 4.
Categorization of miRNA-target interactions. A, Defining miRNA-target interaction categories based on the significance level of miRNA-mRNA, miRNA-protein and miRNA-ratio correlation. RD: mRNA Decay; RD_o: mRNA Decay with other mechanisms; TR: Translational Repression; TR_o: Translational Repression with other mechanisms; B_s: Both strong; B_w: Both weak. B, Cumulative distributions of miRNA-ratio correlation in categories RD, RD_o, B_w, and background (all miRNA-gene pairs), respectively. C, Cumulative distributions of miRNA-mRNA correlation in categories TR, TR_o, B_w, and background, respectively. D–I, Typical correlation patterns of miRNA-mRNA, miRNA-protein and miRNA-ratio in each category, RD (D), TR (E), B_s (F), RD_o (G), TR_o (H), and B_w (I). Plotted are the expression variation curves across nine cell lines for miRNA (black), mRNA (red), protein (green) and protein-to-mRNA ratio (blue). Bold lines suggest expressions significantly correlated with miRNA abundance. Three kinds of correlation coefficients were given in parenthesis.
Fig. 5.
Fig. 5.
miR-138 and its target genes. A, Interactions between miR-138 and its target genes. Edges and nodes are annotated in the boxes. Edge color represents interaction category defined in this study; edge type represents level of supporting from sequence-based methods including TargetScan, miRanda, and MirTarget2; node color represents functional annotation. B, Expression data of miR-138 in different cell lines. Red and green represent relative high- and low-expression, respectively. C, Relative expression of miR-138 and its target genes in SW620 versus SW480 as measured by log2 ratio (*FDR<0.05, Poisson regression model).
Fig. 6.
Fig. 6.
miR-141, miR-200c and their target genes. A, Interactions between miR-141, miR-200c and their target genes. Edges and nodes are annotated in the boxes. Edge color represents interaction category defined in this study; edge type represents level of supporting from sequence-based methods including TargetScan, miRanda and MirTarget2; node color represents functional annotation. B, Expression data for these two miRNAs in different cell lines. Red and green represent relative high- and low-expression, respectively.

Similar articles

Cited by

References

    1. Bartel D. P. (2004) MicroRNAs: genomics, biogenesis, mechanism, and function. Cell 116, 281–297 - PubMed
    1. Baek D., Villén J., Shin C., Camargo F. D., Gygi S. P., Bartel D. P. (2008) The impact of microRNAs on protein output. Nature 455, 64–71 - PMC - PubMed
    1. Selbach M., Schwanháusser B., Thierfelder N., Fang Z., Khanin R., Rajewsky N. (2008) Widespread changes in protein synthesis induced by microRNAs. Nature 455, 58–63 - PubMed
    1. Farh K. K., Grimson A., Jan C., Lewis B. P., Johnston W. K., Lim L. P., Burge C. B., Bartel D. P. (2005) The widespread impact of mammalian MicroRNAs on mRNA repression and evolution. Science 310, 1817–1821 - PubMed
    1. Filipowicz W., Bhattacharyya S. N., Sonenberg N. (2008) Mechanisms of post-transcriptional regulation by microRNAs: are the answers in sight? Nat. Rev. Genet. 9, 102–114 - PubMed

Publication types

LinkOut - more resources