

An Ultra-High-Density, Transcript-Based, Genetic Map of Lettuce
- PMID: 23550116
- PMCID: PMC3618349
- DOI: 10.1534/g3.112.004929
An Ultra-High-Density, Transcript-Based, Genetic Map of Lettuce
Abstract
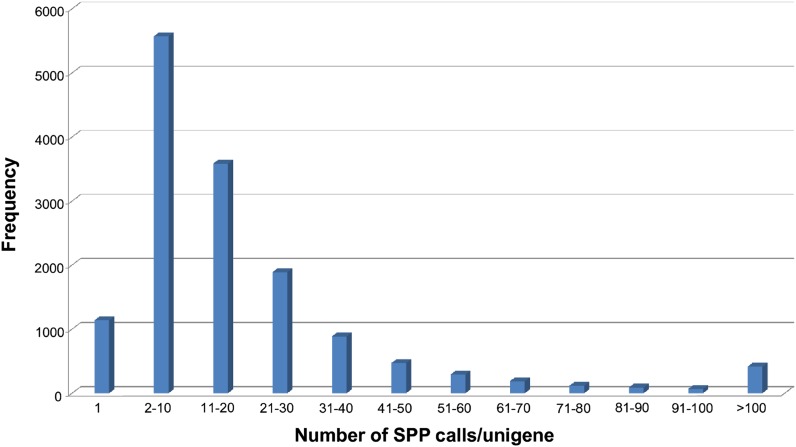
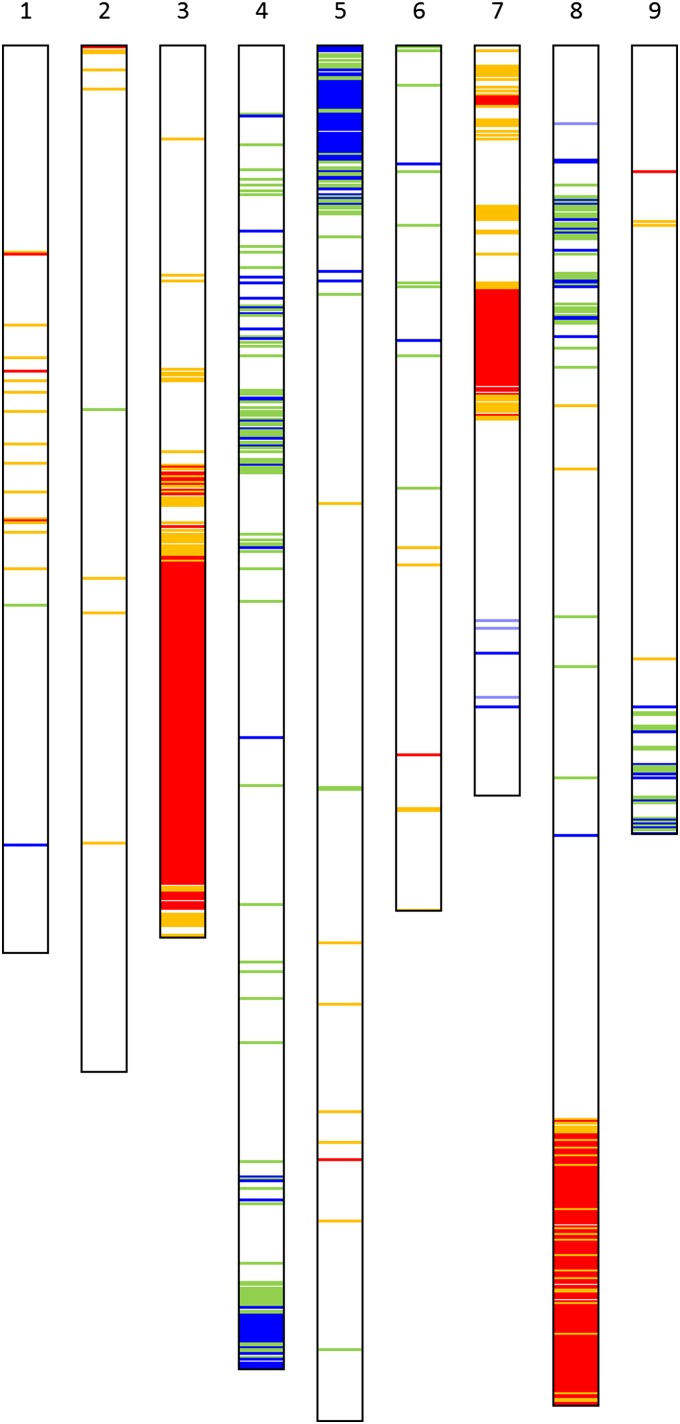
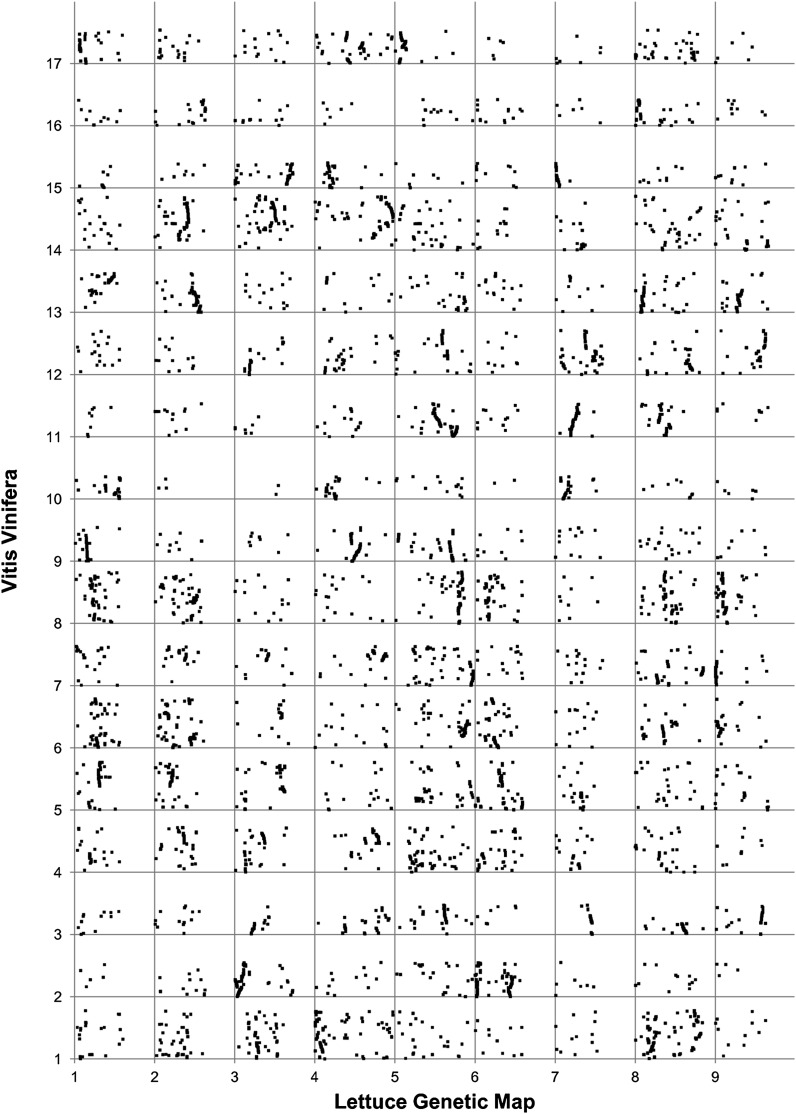
We have generated an ultra-high-density genetic map for lettuce, an economically important member of the Compositae, consisting of 12,842 unigenes (13,943 markers) mapped in 3696 genetic bins distributed over nine chromosomal linkage groups. Genomic DNA was hybridized to a custom Affymetrix oligonucleotide array containing 6.4 million features representing 35,628 unigenes of Lactuca spp. Segregation of single-position polymorphisms was analyzed using 213 F7:8 recombinant inbred lines that had been generated by crossing cultivated Lactuca sativa cv. Salinas and L. serriola acc. US96UC23, the wild progenitor species of L. sativa The high level of replication of each allele in the recombinant inbred lines was exploited to identify single-position polymorphisms that were assigned to parental haplotypes. Marker information has been made available using GBrowse to facilitate access to the map. This map has been anchored to the previously published integrated map of lettuce providing candidate genes for multiple phenotypes. The high density of markers achieved in this ultradense map allowed syntenic studies between lettuce and Vitis vinifera as well as other plant species.
Keywords: Lactuca sativa; linkage analysis; microarray; recombination.
Copyright © 2013 Truco et al.
Figures
Comment on
-
High-density haplotyping with microarray-based expression and single feature polymorphism markers in Arabidopsis.Genome Res. 2006 Jun;16(6):787-95. doi: 10.1101/gr.5011206. Epub 2006 May 15. Genome Res. 2006. PMID: 16702412 Free PMC article.
-
Genome-wide patterns of single-feature polymorphism in Arabidopsis thaliana.Proc Natl Acad Sci U S A. 2007 Jul 17;104(29):12057-62. doi: 10.1073/pnas.0705323104. Epub 2007 Jul 12. Proc Natl Acad Sci U S A. 2007. PMID: 17626786 Free PMC article.
-
Development and evaluation of a high-throughput, low-cost genotyping platform based on oligonucleotide microarrays in rice.Plant Methods. 2008 May 29;4:13. doi: 10.1186/1746-4811-4-13. Plant Methods. 2008. PMID: 18510771 Free PMC article.
-
A microarray-based genotyping and genetic mapping approach for highly heterozygous outcrossing species enables localization of a large fraction of the unassembled Populus trichocarpa genome sequence.Plant J. 2009 Jun;58(6):1054-67. doi: 10.1111/j.1365-313X.2009.03828.x. Epub 2009 Feb 10. Plant J. 2009. PMID: 19220791
-
Development and application of a 6.5 million feature Affymetrix Genechip® for massively parallel discovery of single position polymorphisms in lettuce (Lactuca spp.).BMC Genomics. 2012 May 14;13:185. doi: 10.1186/1471-2164-13-185. BMC Genomics. 2012. PMID: 22583801 Free PMC article.
References
-
- Argyris J., Truco M. J., Ochoa O., Knapp S. J., Still D. W., et al. , 2005. Quantitative trait loci associated with seed and seedling traits in Lactuca. Theor. Appl. Genet. 111: 1365–1376 - PubMed
-
- Argyris J. M., Dahal P., Hayashi E., Still D. W., Bradford K. J., 2008. Genetic variation for lettuce seed thermoinhibition is associated with temperature-sensitive expression of abscisic acid, gibberellins, and ethylene biosynthesis, metabolism, and response genes. Plant Physiol. 148: 926–947 - PMC - PubMed
-
- Banks T. W., Jordan M. C., Somers D. J., 2009. Single-feature polymorphism mapping in bread wheat. Plant Genome 2: 167–178
Publication types
MeSH terms
Substances
LinkOut - more resources
Full Text Sources
Other Literature Sources
Miscellaneous