. 2013 Apr 9;3(4):675-686.
doi: 10.1534/g3.113.005660.

Comparative Genomics of Serial Isolates of Cryptococcus neoformans Reveals Gene Associated With Carbon Utilization and Virulence

Affiliations

Comparative Genomics of Serial Isolates of Cryptococcus neoformans Reveals Gene Associated With Carbon Utilization and Virulence

Kate L Ormerod et al. G3 (Bethesda). .

Abstract

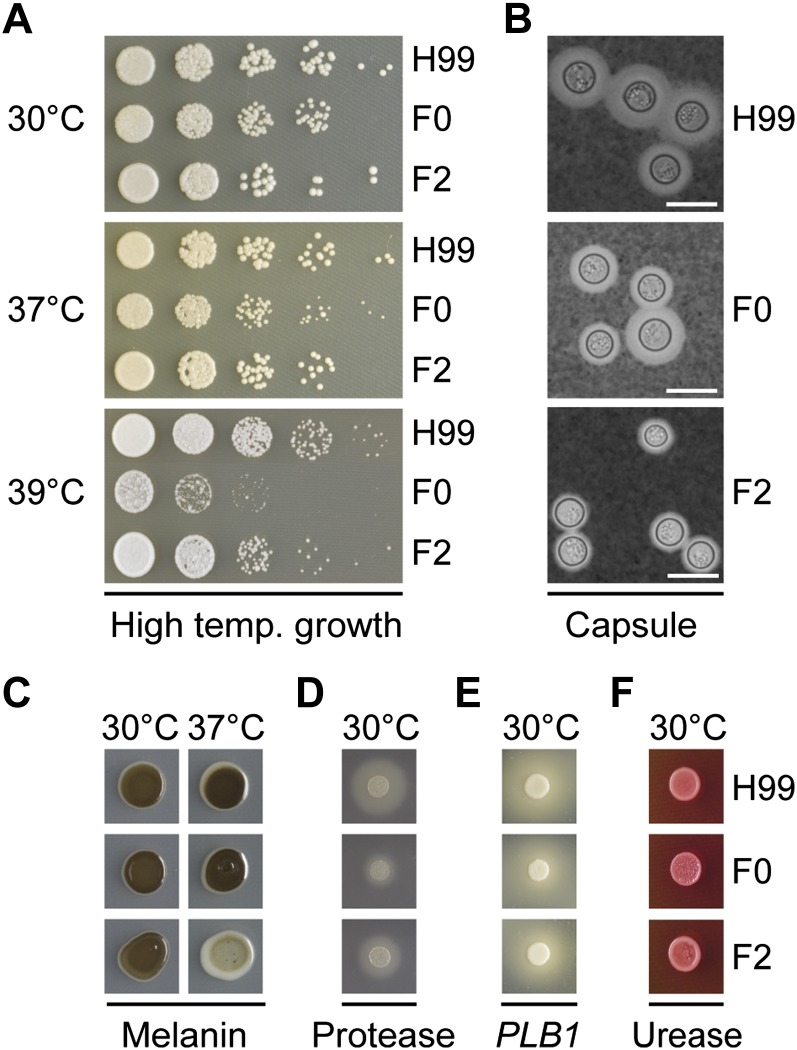
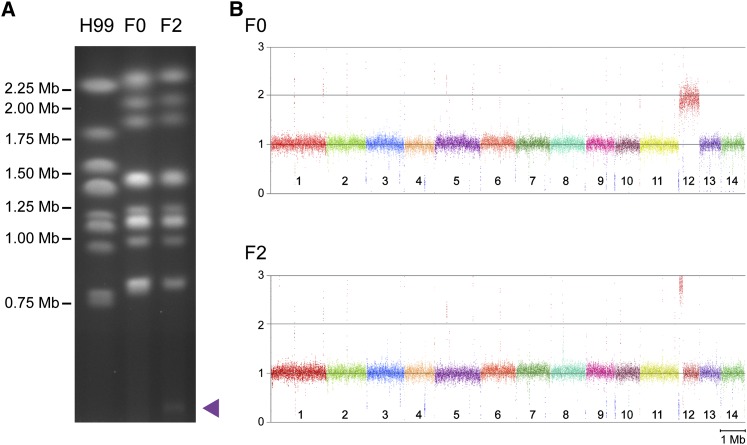
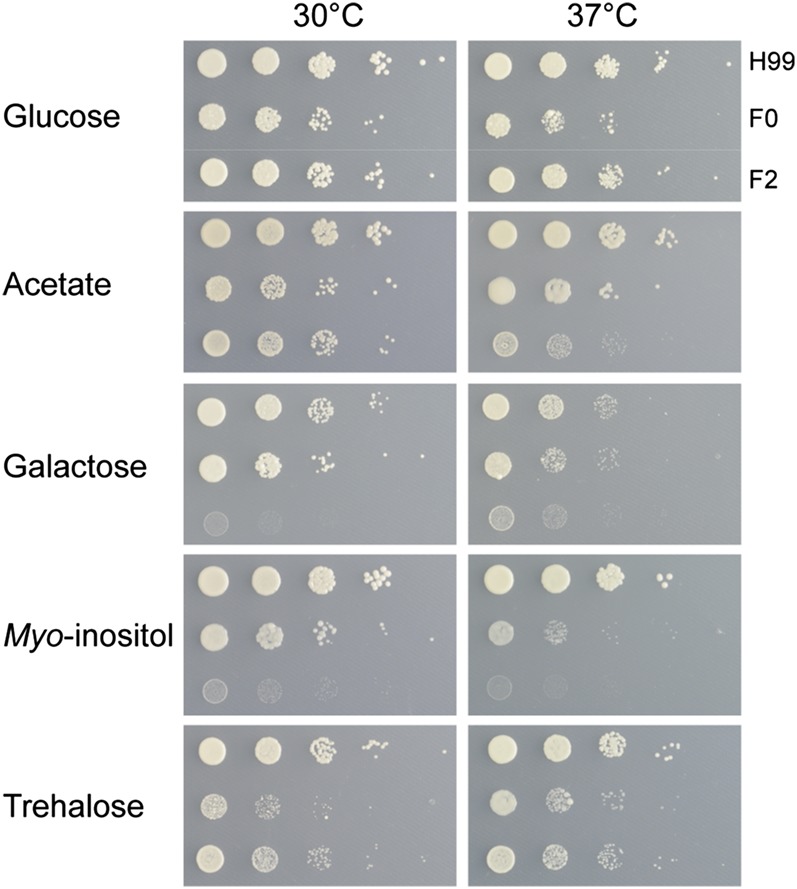
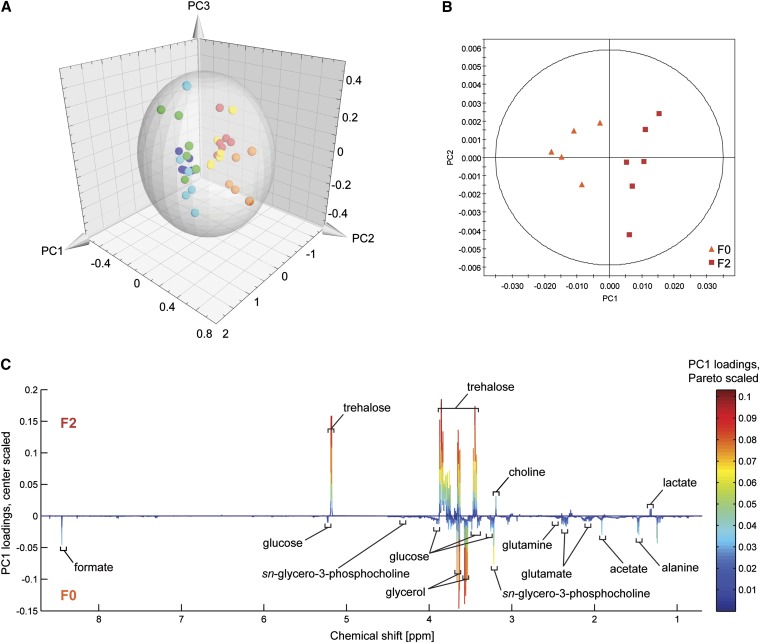
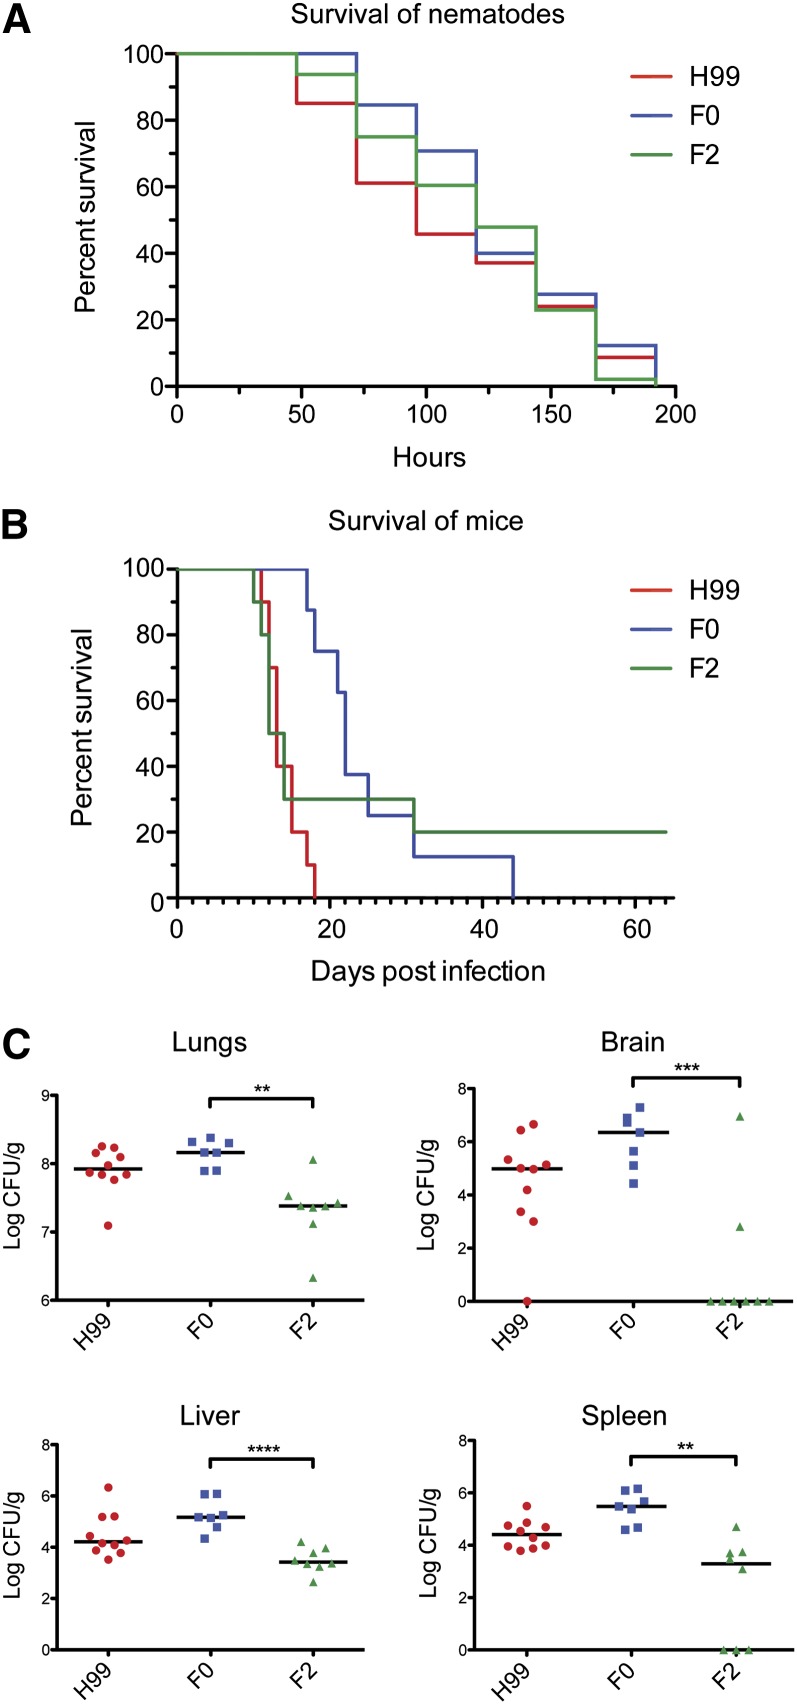
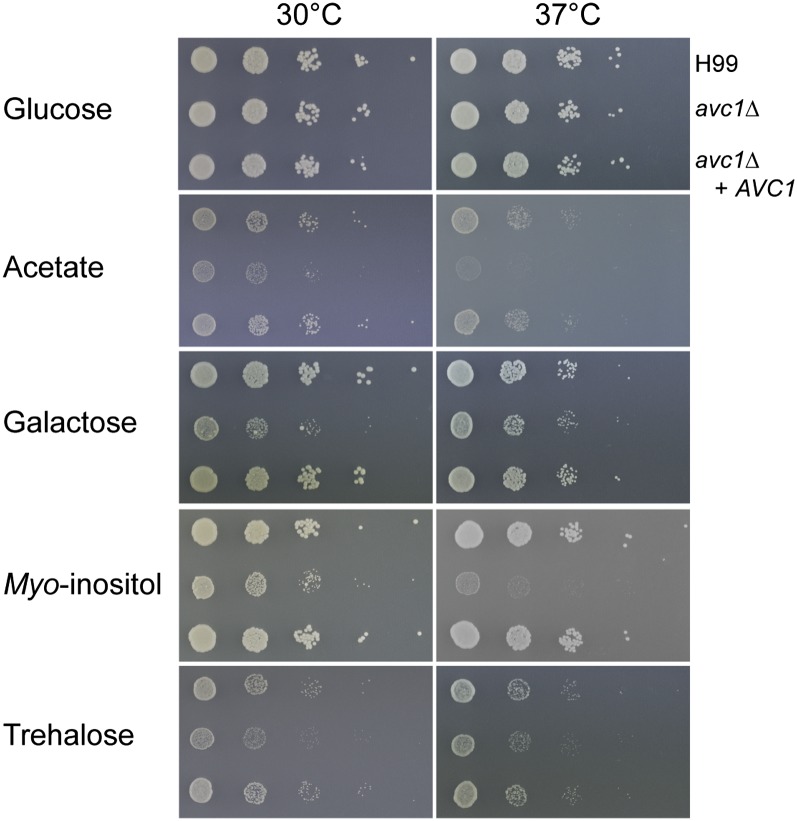
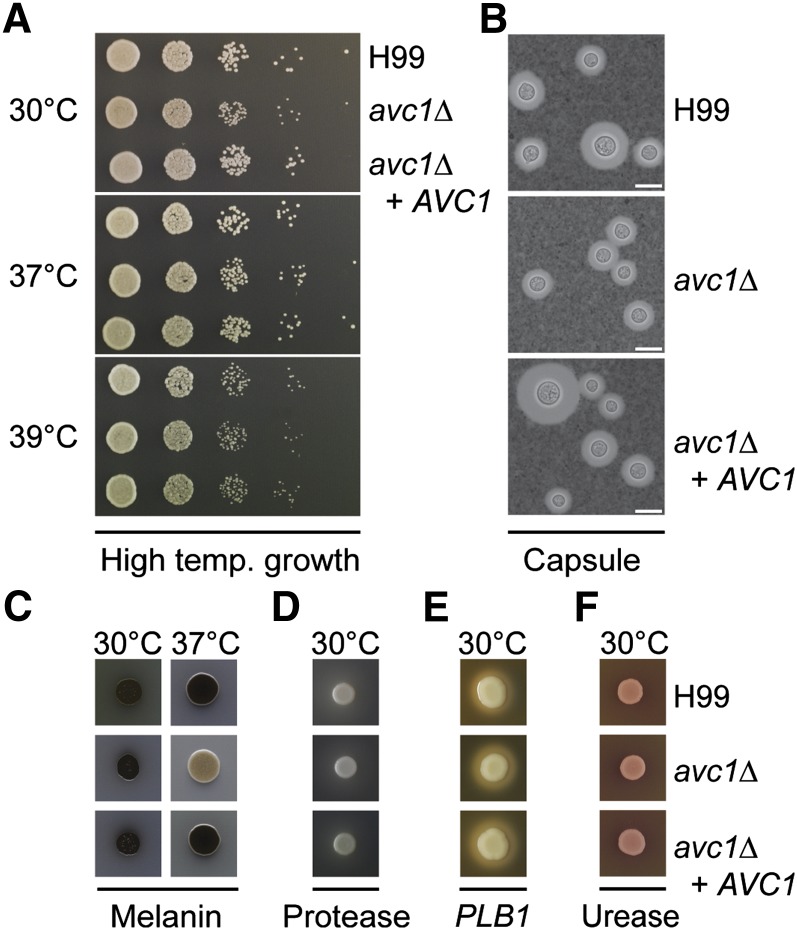
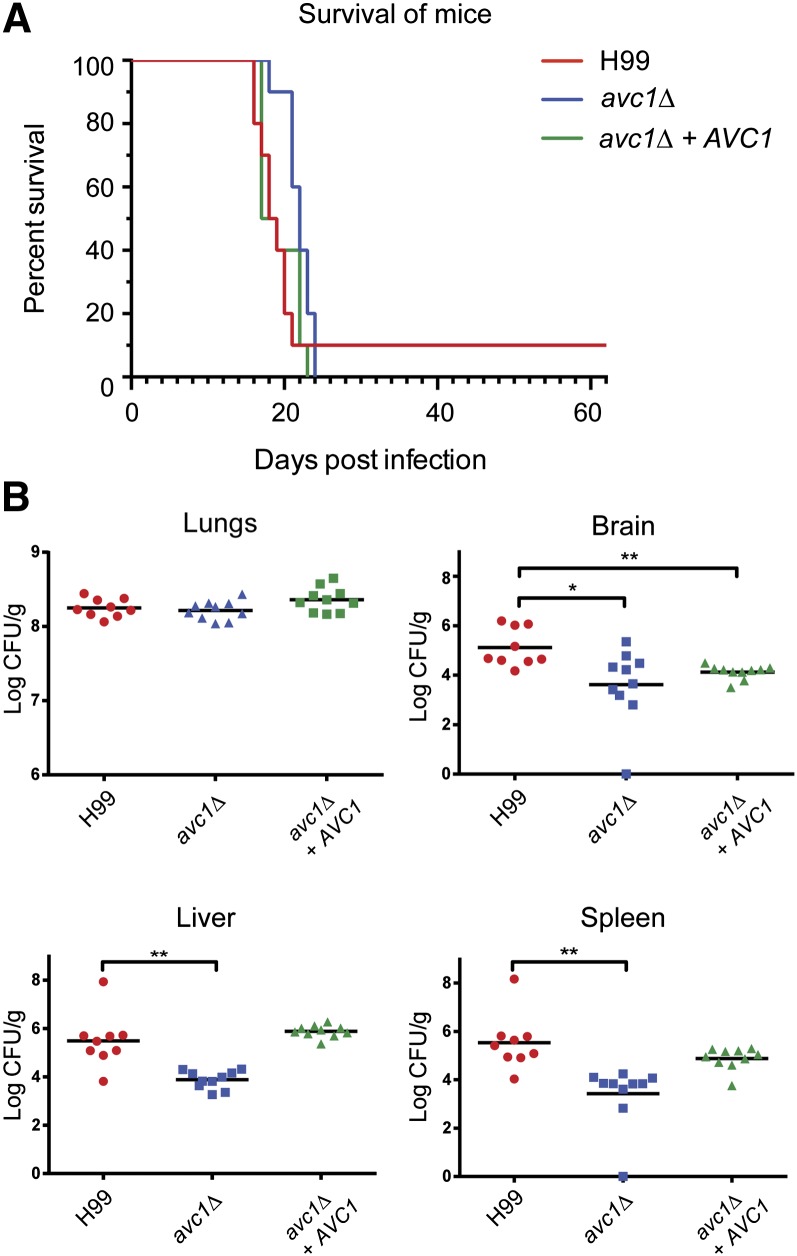
The opportunistic fungal pathogen Cryptococcus neoformans is a leading cause of mortality among the human immunodeficiency virus/acquired immunodeficiency syndrome population and is known for frequently causing life-threatening relapses. To investigate the potential contribution of in-host microevolution to persistence and relapse, we have analyzed two serial isolates obtained from a patient with acquired immunodeficiency syndrome who suffered an initial and relapse episode of cryptococcal meningoencephalitis. Despite being identical by multilocus sequence typing, the isolates differ phenotypically, exhibiting changes in key virulence factors, nutrient acquisition, metabolic profiles, and the ability to disseminate in an animal model. Whole-genome sequencing uncovered a clonal relationship, with only a few unique differences. Of these, two key changes are expected to explain the phenotypic differences observed in the relapse isolate: loss of a predicted AT-rich interaction domain protein and changes in copy number of the left and right arms of chromosome 12. Gene deletion of the predicted transcriptional regulator produced changes in melanin, capsule, carbon source use, and dissemination in the host, consistent with the phenotype of the relapse isolate. In addition, the deletion mutant displayed altered virulence in the murine model. The observed differences suggest the relapse isolate evolved subsequent to penetration of the central nervous system and may have gained dominance following the administration of antifungal therapy. These data reveal the first molecular insights into how the Cryptococcus neoformans genome changes during infection of humans and the manner in which microevolution progresses in this deadly fungal pathogen.

Keywords: cryptococcosis; fungal pathogenesis; microevolution; relapse.


Figures

Figure 1
Figure 1
Strains F0 and F2 differ in their production of several virulence factors. (A) Growth assays at 30°, human body temperature of 37°, and febrile body temperature of 39° on YPD. F2 displays similar growth to H99 at 30 and 37° but diminished growth at 39°. (B) India ink staining under light microscopy reveals the capsule; F2 is reduced compared with F0. Scale bar is 10 μM. (C) Melanization was comparable at 30° on l-DOPA−containing media; however, F2 was not melanized at 37°. (D) F0 produces lower levels of extracellular protease when grown on bovine serum albumin agar. (E) and (F) Comparable levels of phospholipase and urease production were observed when strains were grown on egg yolk and Christensen’s agar, respectively.
Figure 2
Figure 2
Extensive SNVs and indels are observed in F0 and F2 compared with H99. Circos plot of the 14 Cryptococcus chromosomes (outermost rectangles) depicting the >12,000 SNVs and 1200 indels detected in serial isolates F0 and F2 compared with the reference strain H99. Inner rings represent (from outermost): SNVs common to F0 and F2, indels common to F0 and F2, SNVs and indels unique to F0; and SNVs and indels unique to F2.
Figure 3
Figure 3
Karyotypic analysis reveals a minichromosome in F2 associated with aneuploidy observed via read depth analysis. (A) Pulsed-field gel electrophoresis of reference strain H99 and serial isolates F0 and F2 reveals a minichromosome of approximately 300 kb. (B) Read depth analysis of serial isolates F0 and F2 in comparison with H99 indicates a duplication of chromosome 12 in F0 and a triplication of the left arm of chromosome 12 in F2.
Figure 4
Figure 4
Strains F0 and F2 exhibit different growth on alternate carbon sources. Growth assays on minimal media supplemented with various carbon sources. F0 displays diminished growth on glucose and trehalose at 30 and 37°. F2 displays poor growth on galactose and myo-inositol at both temperatures, and acetate at 37°.
Figure 5
Figure 5
Strains F0 and F2 exhibit different metabolic profiles. (A) Three-dimensional scores plot of the PCA analysis of F0, F2, and H99 under two different growth conditions. All six metabolic types can be distinguished. Red: F2 in YNB; orange: F0 in YNB; yellow: H99 in YNB; green: F2 in YPD; cyan: F0 in YPD; blue: H99 in YPD. Hotelling’s 95% confidence range of the PCA model is indicated by the ellipsoid. (B) PCA scores plot of principal components 1 and 2 for F0 (orange triangles) and F2 (red squares) in YNB. Distance between the points is an indicator of similarity between the samples. (C) Corresponding bivariate loadings line plot. The line plot displays on the loadings coefficient axis the (center scaled) correlation coefficients that relate individual integral regions of the NMR spectrum to the PC1 axis of the scores plot. Individual peaks correspond to peaks in the 1D NMR spectra; peaks that are positive indicate metabolites significantly increased in F2 whereas negative peaks are increased in F0. The overlaid heat map relates the relative contribution of the peak to the scores plot when using Pareto scaling instead of center scaling.
Figure 6
Figure 6
F0 and F2 exhibit significantly different dissemination patterns despite apparently similar virulence. (A) No significant difference in survival was seen between each of the strains when young adult C. elegans worms were cultured on indicated strains. (B) A murine virulence assay revealed no significant difference in virulence between F0 and F2; H99 was significantly more virulent than F0 (P = 0.0001). (C) F0 and F2 exhibited significantly different patterns of organ burden: *P < 0.05, **P < 0.01, ***P < 0.001, ****P < 0.0001; Student’s two-tailed t-test, two sample, equal variance (liver) or unequal variance (lungs, brain, spleen).
Figure 7
Figure 7
The growth of the deletion mutant avc1Δ resembles that of relapse isolate F2 on alternate carbon sources. Growth assays on minimal media supplemented with various carbon sources. Growth inhibition of avc1Δ is abolished after reintroduction of the gene.
Figure 8
Figure 8
Capsule and melanin production are inhibited in avc1Δ. (A) Growth assays at 30°, human body temperature of 37° and febrile body temperature of 39° on YPD; no change was observed following deletion of AVC1. (B) India ink staining under light microscopy reveals the capsule; capsule production is inhibited in avc1Δ and restored following reintroduction of the gene. Scale bar is 10 μM. (C) Melanization on l-DOPA containing media is inhibited in avc1Δ and restored following reintroduction of the gene. (D−F) Comparable levels of protease, phospholipase, and urease production were observed in all strains when grown on bovine serum albumin, egg yolk, and Christensen’s agar, respectively.
Figure 9
Figure 9
The deletion mutant avc1Δ exhibits reduced virulence and altered dissemination. (A) A murine virulence assay revealed a significant difference in virulence between H99 and avc1Δ (P = 0.0077); no significant difference was observed between H99 and avc1Δ + AVC1. (B) H99 and avc1Δ exhibited significantly different patterns of organ burden: *P < 0.05, **P < 0.01; Student’s two-tailed t-test, two sample, equal variance [lungs, brain (avc1Δ), spleen (avc1Δ)] or unequal variance [brain (avc1Δ + AVC1), liver, spleen (avc1Δ + AVC1)].

References

    1. Albers C. A., Lunter G., MacArthur D. G., McVean G., Ouwehand W. H., et al. , 2011. Dindel: Accurate indel calls from short-read data. Genome Res. 21: 961–973 - PMC - PubMed
    1. Altschul S. F., Gish W., Miller W., Myers E. W., Lipman D. J., 1990. Basic local alignment search tool. J. Mol. Biol. 215: 403–410 - PubMed
    1. Brenner S., 1974. Genetics of Caenorhabditis elegans. Genetics 77: 71–94 - PMC - PubMed
    1. Bubb W. A., Wright L. C., Cagney M., Santangelo R. T., Sorrell T. C., et al. , 1999. Heteronuclear NMR studies of metabolites produced by Cryptococcus neoformans in culture media: Identification of possible virulence factors. Magn. Reson. Med. 42: 442–453 - PubMed
    1. Chen K., Wallis J. W., McLellan M. D., Larson D. E., Kalicki J. M., et al. , 2009. BreakDancer: an algorithm for high-resolution mapping of genomic structural variation. Nat. Methods 6: 677–681 - PMC - PubMed

Publication types

LinkOut - more resources