Review
. 2013 May;253(1):65-81.
doi: 10.1111/imr.12061.

MicroRNA regulation of T-cell differentiation and function

Affiliations
Review

MicroRNA regulation of T-cell differentiation and function

Lukas T Jeker et al. Immunol Rev. 2013 May.

Abstract

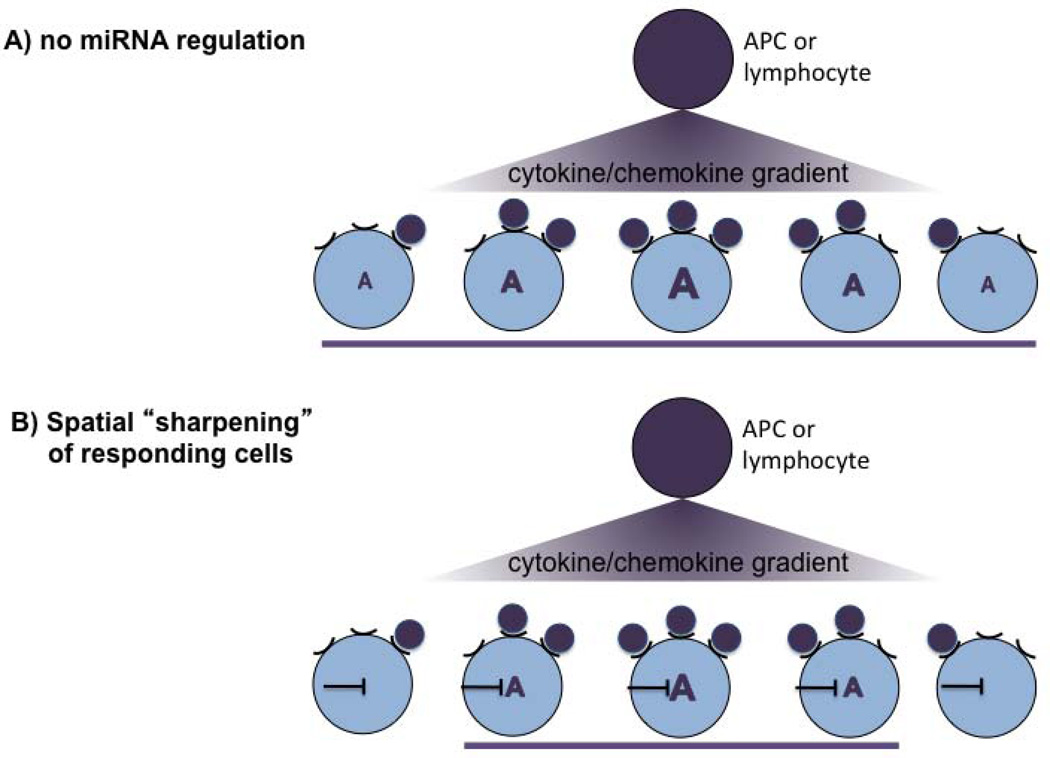
MicroRNAs (miRNAs) are emerging as key controllers of T-cell differentiation and function. Their expression is dynamically regulated by extracellular signals such as costimulation and cytokine signals. miRNAs set thresholds for gene expression and optimize protein concentrations of genetic networks. Absence of individual miRNAs can lead to severe immune dysfunction. In this study, we review emerging principles and provide examples of important functions exerted by miRNAs. Although our understanding of miRNA function in T-cell differentiation is still rudimentary, the available evidence leaves no doubt that these small post-transcriptional regulators are indispensable for proper functioning of the immune system.


Conflict of interest statement

The authors have no conflicts of interest to declare.

Figures

Fig. 1
Fig. 1. DGCR8-deficient Tregs lose FoxP3 and turn into IFN-γ-producing miRNA-deficient exFoxP3 cells
Tregs from FoxP3-GFP-hCre.R26YFP.DGCR8wt/lox (HET) and FoxP3-GFP-hCre.R26YFP.DGCR8lox/lox (KO) mice were used to investigate the contribution of miRNAs to Treg lineage identity. Flow cytometry purified CD4+CD8YFP+ lymphocytes were cultured with anti-CD3 and anti-CD28 beads and 2000U IL-2/ml (Treg expansion conditions). (A) Intracellular FoxP3 staining of purified YFP+ cells at d0 and d5 and YFP purity 5 days after culture. (B) On day 8, CD4+CD8YFP+ lymphocytes were resorted and then restimulated for 2h with PMA/ionomycin in the presence of monensin. Representative FACS plots of intracellular FoxP3 and IFN-γ staining. CD4+YFP Tconv cells are shown as a comparison for CD4+YFP+ cells. Representative data from at least 2 experiments.
Fig. 2
Fig. 2. Alternative polyadenylation regulates miRNA-mediated gene repression
Schematic representation of a model gene with constant transcription (arrow) of a coding sequence and its 3′ untranslated region (3′UTR). (A) During steady-state condition the interaction of a given miRNA with the 3′UTR of the target gene results in a defined protein output. (B) Induction of the miRNA leads to stronger repression of the gene leading to decreased protein output. (C) Shortening of the 3′UTR through alternative polyadenylation leads to avoidance of miRNA regulation despite the continued presence of the miRNA. Protein output increases as a result.
Fig. 3
Fig. 3. Interplay of miRNA expression and 3′UTR usage shapes genetic networks
Schematic representation of an extracellular cue (e.g. cytokine) on a T cell and its consequence on the genetic network. (A) A cytokine induces a network of genes A–M. (B) miRNA expression allows to shape the gene expression program induced by the cytokine. (C) The interplay of miRNA expression and alternative polyadenylation (APA) provides a cell additional flexibility to respond to the cytokine.
Fig. 4
Fig. 4. miRNAs repress stochastic gene expression by setting a threshold
miRNAs can set genetic thresholds. (A) Random interaction of a cytokine with its receptor results in a subthreshold integrated response, which does not pass the threshold and therefore the cell does not react. (B) Continued or stronger cytokine signals amplify the integrated response which leads to an output once the threshold is passed. (C) In the absence of miRNA regulation, there is no threshold and therefore random cytokine signals lead to a cellular response. (D) In the absence of a miRNA the cell responds to continued or stronger cytokine signals. The response can be the same or intensified.
Fig. 5
Fig. 5. Spatial sharpening of cells responding to a cytokine/chemokine gradient
A model how a miRNA-mediated threshold can spatially sharpen responsivness to a chemical gradient. (A) In the absence of a miRNA, all cells that receive a cytokine/chemokine signal respond with gene expression ‘A’. The strength of the response is dose-dependent and correlates with the cytokine/chemokine concentration in the gradient. (B) Presence of a miRNA reduces responsiveness of cells receiving very low signals. This leads to spatial sharpening of the responding cells (purple bar). Thus, although the cell will be exposed to the cytokine and expresses its receptor, it will not react to it. This potentially allows to ‘sharpen’ the functional consequences of a cytokine/chemokine gradient in a given microenvironment without altering the cytokine/chemokine gradient itself.

References

    1. O'Shea JJ, Paul WE. Mechanisms underlying lineage commitment and plasticity of helper CD4+ T cells. Science. 2010;327:1098–1102. - PMC - PubMed
    1. Zhu J, Yamane H, Paul WE. Differentiation of effector CD4 T cell populations. Annu Rev Immunol. 2010;28:445–489. - PMC - PubMed
    1. Sharp PA. The centrality of RNA. Cell. 2009;136:577–580. - PubMed
    1. Derrien T, et al. The GENCODE v7 catalog of human long noncoding RNAs: analysis of their gene structure, evolution, and expression. Genome Res. 2012;22:1775–1789. - PMC - PubMed
    1. Dunham I, et al. An integrated encyclopedia of DNA elements in the human genome. Nature. 2012;489:57–74. - PMC - PubMed

Publication types