

Functional consequences of WNT3/Frizzled7-mediated signaling in non-transformed hepatic cells
- PMID: 23552403
- PMCID: PMC3503290
- DOI: 10.1038/oncsis.2012.31
Functional consequences of WNT3/Frizzled7-mediated signaling in non-transformed hepatic cells
Abstract
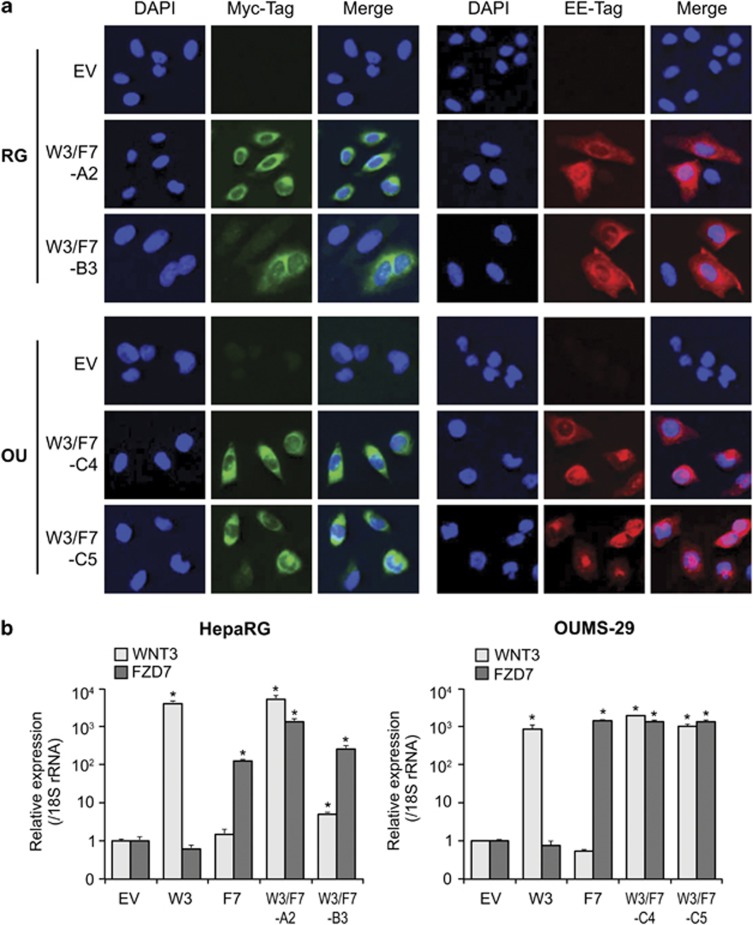
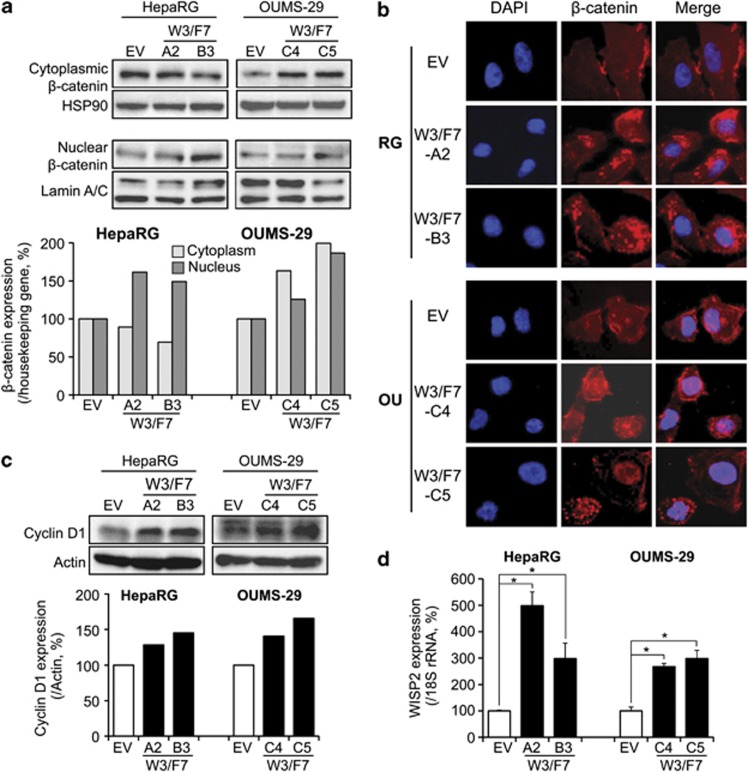
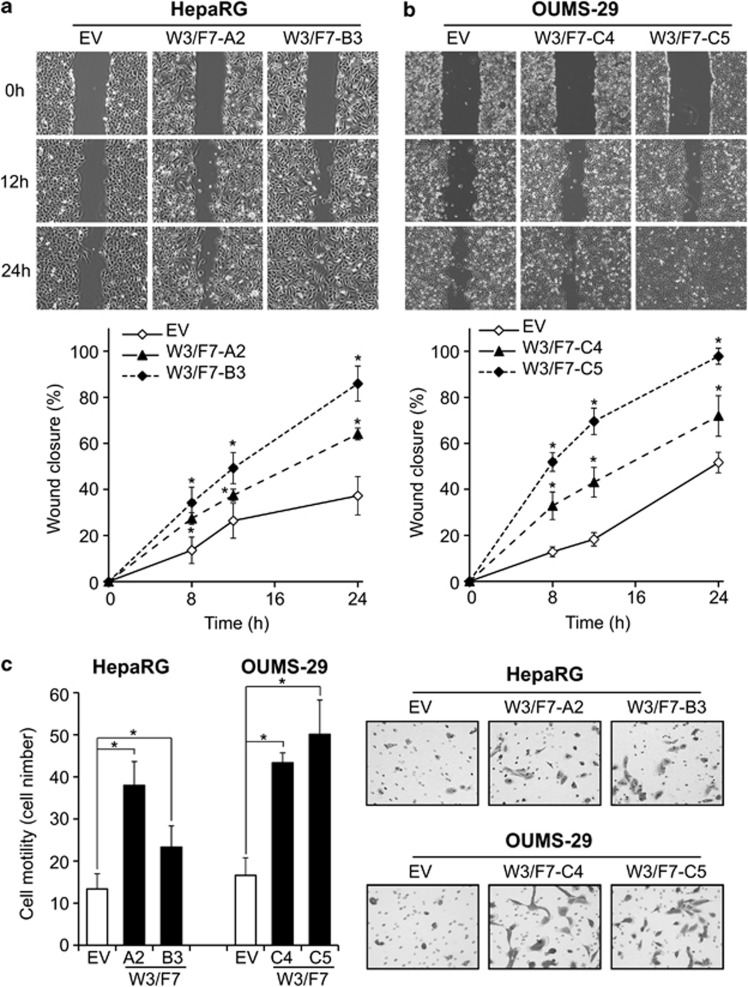
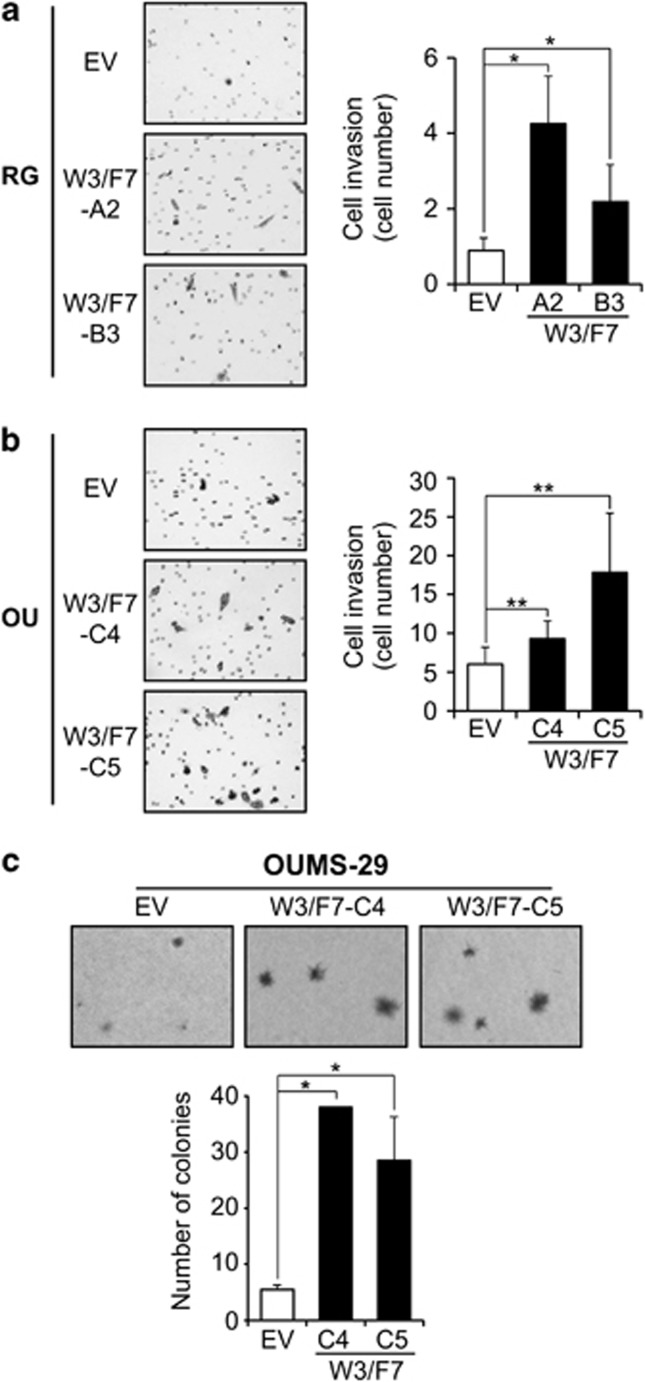
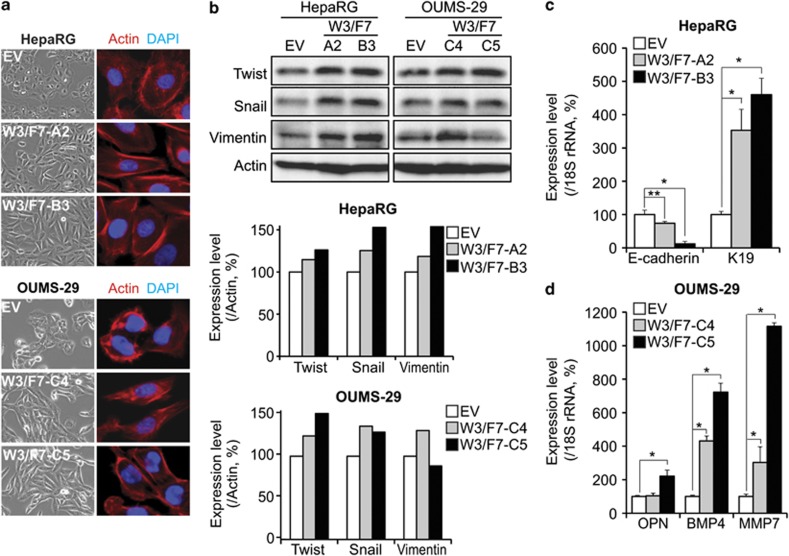
We have previously demonstrated that WNT3 and Frizzled7 (FZD7) expression levelswere upregulated in hepatocellular carcinoma (HCC) and that they directly interact to activate the canonical Wnt/β-catenin pathway in HCC cell lines. In this study, we investigated the functional consequences of WNT3 and FZD7 expression levels in non-transformed hepatic cells to address the question of whether WNT3/FZD7-mediated signal transduction could be involved in cellular transformation. After stable transfection of WNT3 and FZD7, the activation of the Wnt/β-catenin pathway was confirmed by western blot, immunostaining and quantitative real-time reverse transcriptase-PCR (qRT-PCR) analysis in two non-transformed hepatocyte-derived cell lines. In vitro characteristics of the malignant phenotype were measured, including cell proliferation, migration, invasion and anchorage-independent growth in soft agar. Stable expression of WNT3 and FZD7 in the two cell lines led to cellular accumulation of β-catenin and expression of downstream target genes activated by this pathway. In the stable WNT3/FZD7-expressing clones, hepatic cell proliferation, migration, invasion as well as soft agar colony formation were enhanced compared with the non-transformed control cells. The epithelial-mesenchymal transition (EMT) factors, Twist, Snail and Vimentin, were increased in cells expressing WNT3 and FZD7. However, the WNT3/FZD7-expressing cells did not form tumors in vivo. We conclude that activation of the WNT3/FZD7 canonical pathway has a role in the early stages of hepatocarcinogenesis by promoting the acquisition of a malignant phenotype with features of EMT.
Figures

Similar articles
-
Functional interaction between Wnt3 and Frizzled-7 leads to activation of the Wnt/beta-catenin signaling pathway in hepatocellular carcinoma cells.J Hepatol. 2008 May;48(5):780-91. doi: 10.1016/j.jhep.2007.12.020. Epub 2008 Feb 7. J Hepatol. 2008. PMID: 18313787 Free PMC article.
-
Frizzled7 Promotes Epithelial-to-mesenchymal Transition and Stemness Via Activating Canonical Wnt/β-catenin Pathway in Gastric Cancer.Int J Biol Sci. 2018 Feb 12;14(3):280-293. doi: 10.7150/ijbs.23756. eCollection 2018. Int J Biol Sci. 2018. PMID: 29559846 Free PMC article.
-
N-glycosylation of Wnt3 regulates the progression of hepatocellular carcinoma by affecting Wnt/β-catenin signal pathway.World J Gastrointest Oncol. 2024 Jun 15;16(6):2769-2780. doi: 10.4251/wjgo.v16.i6.2769. World J Gastrointest Oncol. 2024. PMID: 38994173 Free PMC article.
-
Soluble Frizzled-7 receptor inhibits Wnt signaling and sensitizes hepatocellular carcinoma cells towards doxorubicin.Mol Cancer. 2011 Feb 11;10:16. doi: 10.1186/1476-4598-10-16. Mol Cancer. 2011. PMID: 21314951 Free PMC article.
-
Functional consequences of frizzled-7 receptor overexpression in human hepatocellular carcinoma.Gastroenterology. 2004 Oct;127(4):1110-22. doi: 10.1053/j.gastro.2004.07.009. Gastroenterology. 2004. PMID: 15480989
Cited by
-
Characterizing the activation of the Wnt signaling pathway in hilar cholangiocarcinoma using a tissue microarray approach.Eur J Histochem. 2016 Feb 9;60(1):2536. doi: 10.4081/ejh.2016.2536. Eur J Histochem. 2016. PMID: 26972709 Free PMC article.
-
DNMT3A-mediated DNA methylation and transcription inhibition of FZD5 suppresses lung carcinogenesis.Heliyon. 2024 Apr 16;10(9):e29733. doi: 10.1016/j.heliyon.2024.e29733. eCollection 2024 May 15. Heliyon. 2024. PMID: 38707304 Free PMC article.
-
WNT ligands in non-small cell lung cancer: from pathogenesis to clinical practice.Discov Oncol. 2023 Jul 24;14(1):136. doi: 10.1007/s12672-023-00739-7. Discov Oncol. 2023. PMID: 37486552 Free PMC article. Review.
-
Garlic-derived compound S-allylmercaptocysteine inhibits hepatocarcinogenesis through targeting LRP6/Wnt pathway.Acta Pharm Sin B. 2018 Jul;8(4):575-586. doi: 10.1016/j.apsb.2017.10.003. Epub 2017 Nov 10. Acta Pharm Sin B. 2018. PMID: 30109182 Free PMC article.
-
The aqueous extract of Ficus religiosa induces cell cycle arrest in human cervical cancer cell lines SiHa (HPV-16 Positive) and apoptosis in HeLa (HPV-18 positive).PLoS One. 2013 Jul 26;8(7):e70127. doi: 10.1371/journal.pone.0070127. Print 2013. PLoS One. 2013. PMID: 23922932 Free PMC article.
References
-
- Ferlay J, Shin HR, Bray F, Forman D, Mathers C, Parkin DM. Estimates of worldwide burden of cancer in 2008: GLOBOCAN 2008. Int J Cancer. 2010;127:2893–2917. - PubMed
Grants and funding
LinkOut - more resources
Full Text Sources
Other Literature Sources
Molecular Biology Databases
Research Materials
