. 2013 Jun;87(12):6668-77.
doi: 10.1128/JVI.00538-13. Epub 2013 Apr 3.

Genome-wide analysis of host mRNA translation during hepatitis C virus infection

Affiliations

Genome-wide analysis of host mRNA translation during hepatitis C virus infection

Hélène Colman et al. J Virol. 2013 Jun.

Erratum in

Abstract

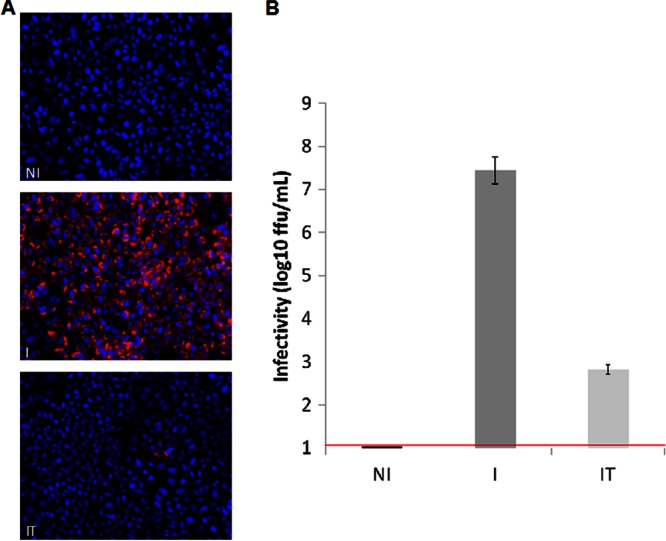
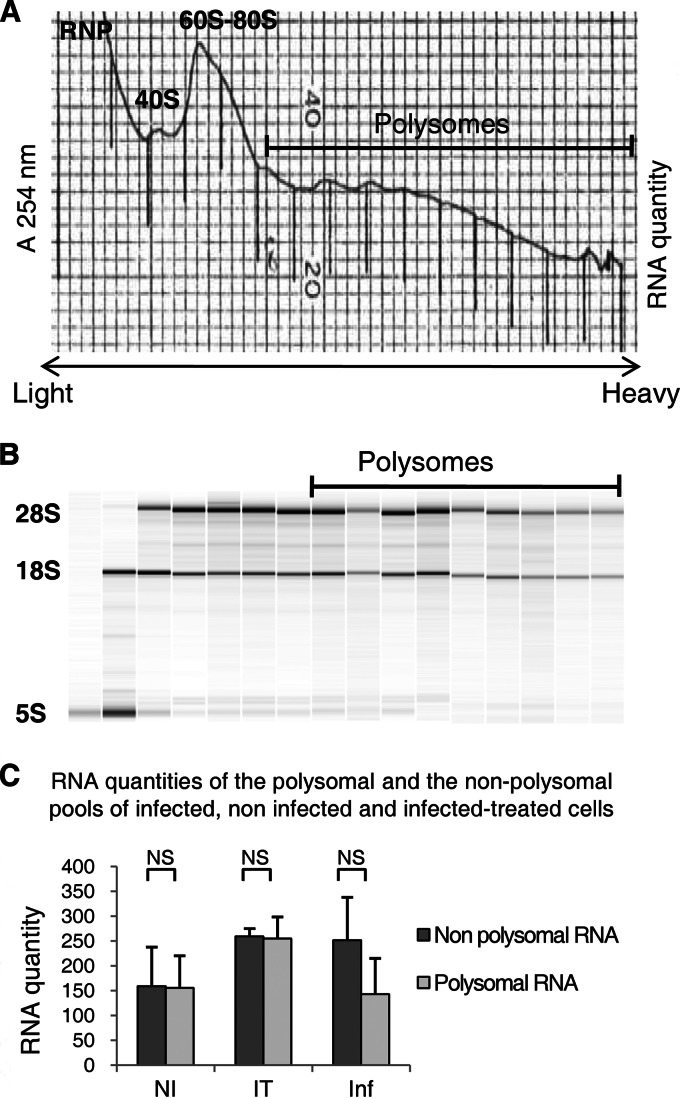
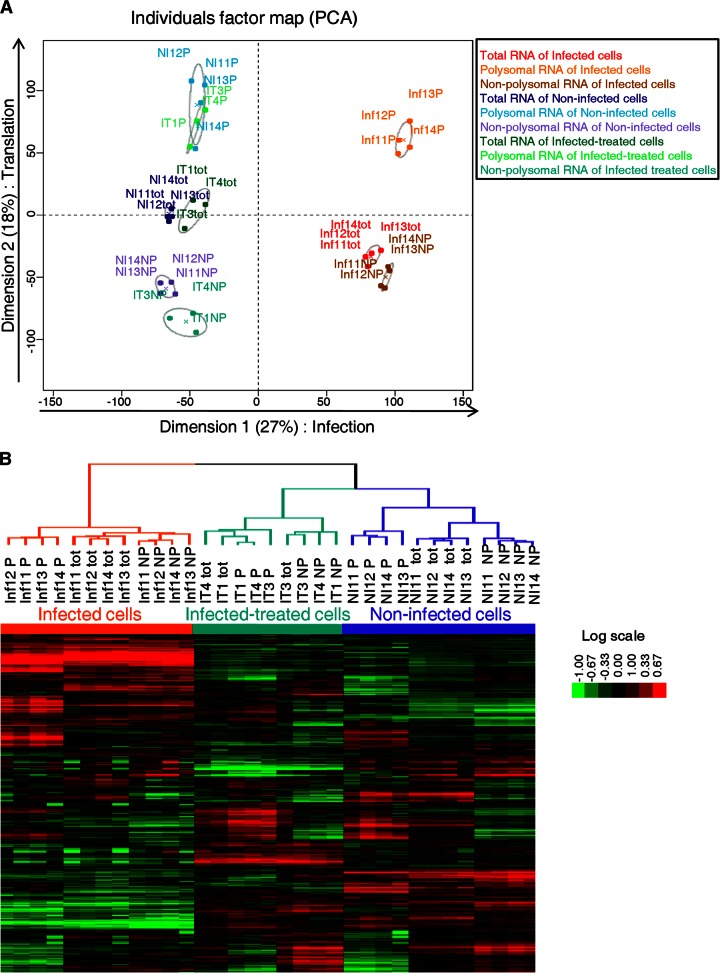
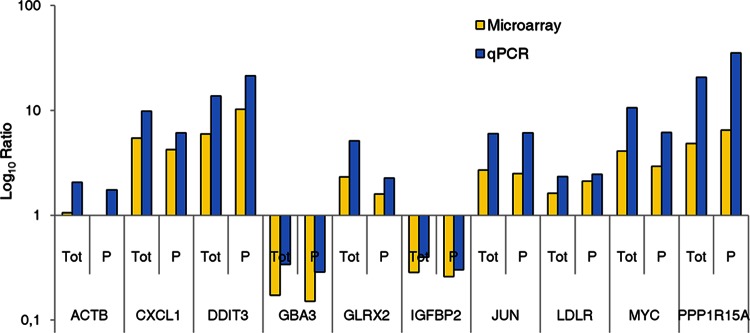
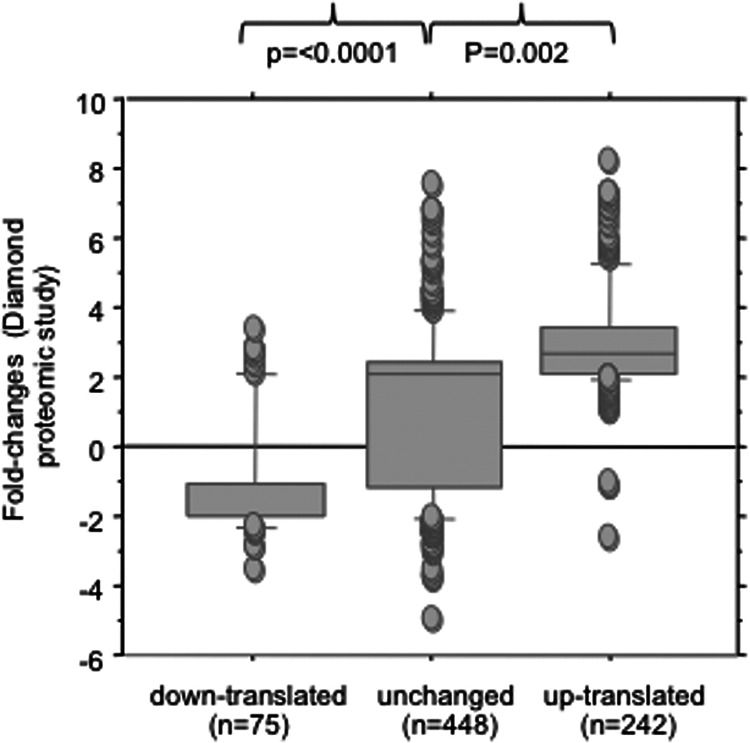
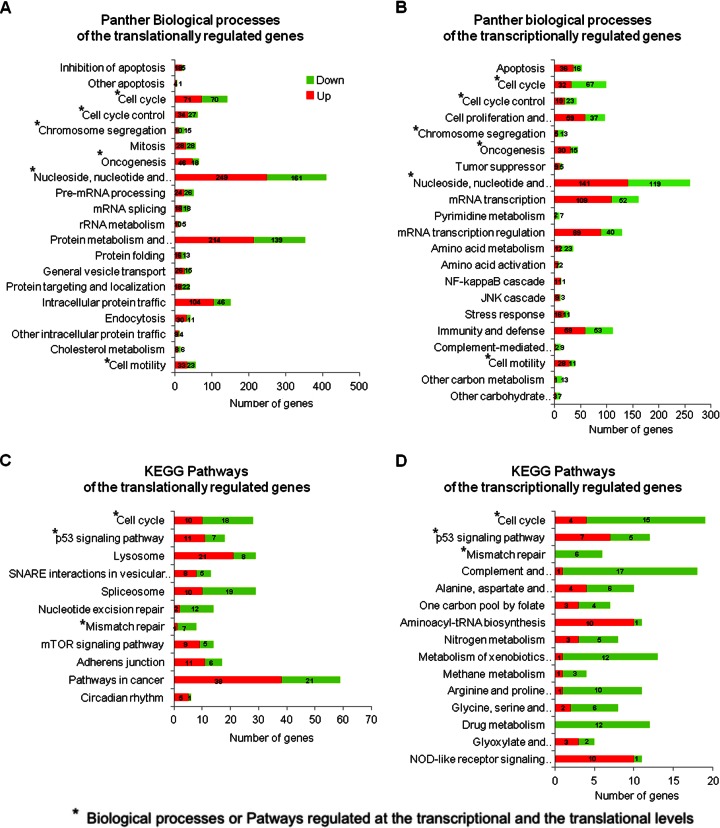
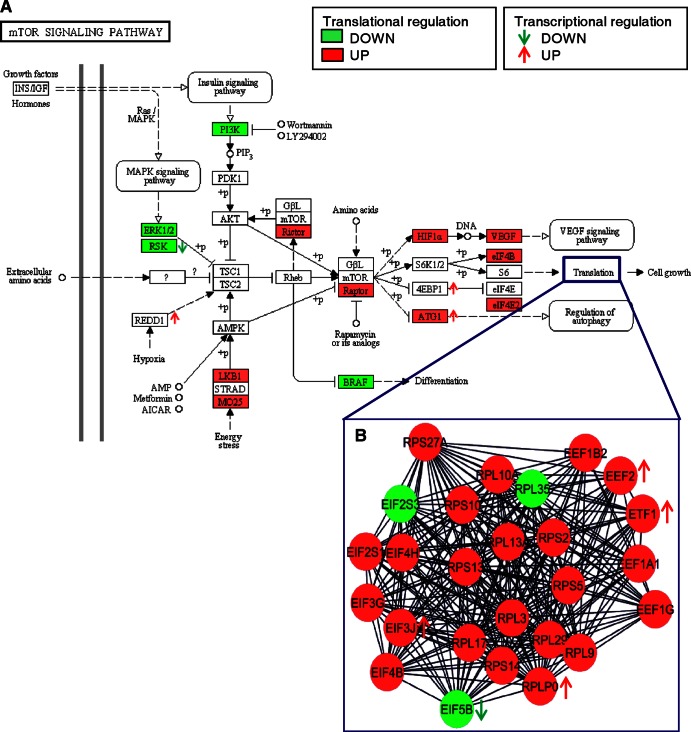
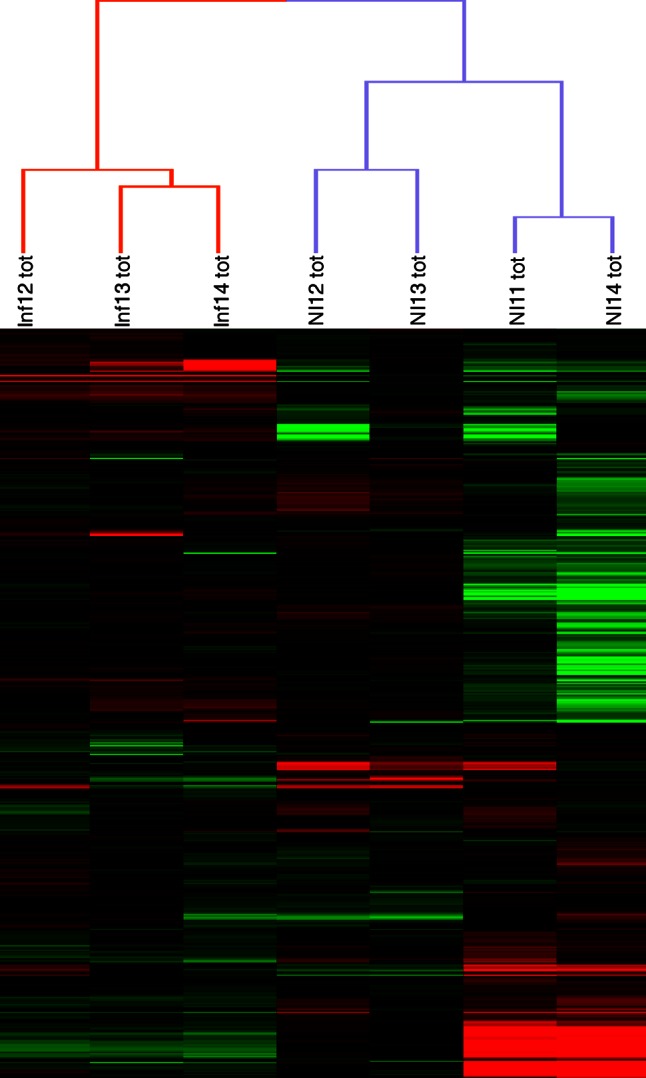
In the model of Huh-7.5.1 hepatocyte cells infected by the JFH1 hepatitis C virus (HCV) strain, transcriptomic and proteomic studies have revealed modulations of pathways governing mainly apoptosis and cell cycling. Differences between transcriptomic and proteomic studies pointed to regulations occurring at the posttranscriptional level, including the control of mRNA translation. In this study, we investigated at the genome-wide level the translational regulation occurring during HCV infection. Sucrose gradient ultracentrifugation followed by microarray analysis was used to identify translationally regulated mRNAs (mRNAs associated with ribosomes) from JFH1-infected and uninfected Huh-7.5.1 cells. Translationally regulated mRNAs were found to correspond to genes enriched in specific pathways, including vesicular transport and posttranscriptional regulation. Interestingly, the strongest translational regulation was found for mRNAs encoding proteins involved in pre-mRNA splicing, mRNA translation, and protein folding. Strikingly, these pathways were not previously identified, through transcriptomic studies, as being modulated following HCV infection. Importantly, the observed changes in host mRNA translation were directly due to HCV replication rather than to HCV entry, since they were not observed in JFH1-infected Huh-7.5.1 cells treated with a potent HCV NS3 protease inhibitor. Overall, this study highlights the need to consider, beyond transcriptomic or proteomic studies, the modulation of host mRNA translation as an important aspect of HCV infection.


Figures

Fig 1
Fig 1
Virological analysis of infected, noninfected, and infected-treated cells. Huh-7.5.1 cells were either left noninfected (NI) or infected with JFH1 and then left untreated (I) or treated with an inhibitor of the HCV serine protease (IT). (A) Infected cells were visualized by immunofluorescence analysis with sera from HCV-seropositive nonviremic patients as the primary antibody (red). Cells were counterstained with DAPI to show the locations of nuclei (blue). (B) Infectivity titers of culture supernatants were determined by focus formation assay. The threshold of detection of the assay is indicated by a red line. Data are shown as means and standard errors of the means of the infectivity titers determined in three or four independent experiments. ffu, focus-forming units.
Fig 2
Fig 2
Polysomal fractionation of infected, noninfected, and infected-treated cell lysates. (A) The absorbance at 254 nm was monitored during collection of the 17 fractions from the sucrose gradient of infected cell lysates. (B) The analysis of RNA extracted from each fraction of an infected cell sample was performed on an Agilent bioanalyzer, allowing the visualization of the 28S and 18S rRNAs. (C) RNA quantities extracted from the polysomal and nonpolysomal pools of infected (I), noninfected (NI), and infected-treated (IT) cells. The quantities of polysomal and free RNAs were nonsignificantly (NS) different (Student's t test) in infected, noninfected, and infected-treated cells.
Fig 3
Fig 3
Global analysis of mRNA levels in total, polysomal, and nonpolysomal RNAs from infected, noninfected, and infected-treated cells. (A) PCA plot of the microarray results for the 33 RNA samples. PCA was performed using the FactoMineR package. Separation along dimension 1 corresponds to infection status and separation along dimension 2 to translation status. This shows marked changes in the total (tot), polysomal (P), and nonpolysomal (NP) RNAs of cells undergoing productive infection. The polysomal fraction is very different from the total RNA fraction, whereas the nonpolysomal fraction is similar to it. (B) Hierarchical clustering of the 33 RNA samples analyzed on microarrays was performed with cluster or Java Treeview software. On the heat map, the rows represent the mRNA quantitation data (log transformed and median centered), and the columns represent the RNA samples.
Fig 4
Fig 4
Validation of microarray by qPCR of selected genes. A subset of 10 genes was randomly chosen to confirm the microarray results by real-time PCR. Log ratios indicate changes observed in total (Tot) and polysomal (P) mRNAs during infection (compared to noninfected controls). The results of mRNA quantification by the two techniques were consistent. As expected, the fold changes were higher with qPCR.
Fig 5
Fig 5
Correlation between proteomic fold changes determined in the data set of Diamond et al. (20) and the ANOTA classification of genes. In the study of Diamond et al., proteomic fold changes of 765 cellular proteins were measured under the same experimental conditions as in the present study, after 3 days of infection of Huh7 cells by JFH1.
Fig 6
Fig 6
DAVID functional annotation of transcriptionally and translationally regulated genes. The translationally (anota) and transcriptionally (Student's t test, P < 0.005, and fold change of >2 in cytosolic RNA) regulated genes were annotated with the Panther gene ontology and KEGG pathway using DAVID software. (A) Panther biological processes significantly associated (Fisher's modified test, P < 0.05) with translationally regulated genes. (B) Panther biological processes significantly associated (Fisher's modified test, P < 0.05) with transcriptionally regulated genes. (C) KEGG pathways significantly associated (Fisher's modified test, P < 0.05) with translationally regulated genes. (D) KEGG pathways significantly associated (Fisher's modified test, P < 0.05) with transcriptionally regulated genes. The plots reflect the number of genes in the process. The number of upregulated genes is represented in red, and the number of downregulated genes is in green.
Fig 7
Fig 7
Translation regulation of the mTOR signaling pathway and translation process. (A) Representation of the mTOR signaling KEGG pathway, significantly associated with translationally regulated genes. The translationally upregulated genes are shown in red and the translationally downregulated genes in green. The direction of transcriptional regulation (P < 0.05, fold change > 2) is indicated by arrows beside the gene names. (B) Representation of the network of interactions between the translationally regulated proteins related to translation (obtained with Cytoscape and the MiMI plugin). As for the KEGG pathway, the translationally upregulated genes are shown in red and the translationally downregulated genes in green, and potential transcriptional regulations are indicated by arrows beside the circles.
Fig 8
Fig 8
Hierarchical clustering of the infected and noninfected samples analyzed on miRNA microarrays. On the heat map, the rows represent the miRNA quantitation data (log transformed and median centered), and the columns represent the RNA samples.

Similar articles

Cited by

References

    1. Aizaki H, Harada T, Otsuka M, Seki N, Matsuda M, Li YW, Kawakami H, Matsuura Y, Miyamura T, Suzuki T. 2002. Expression profiling of liver cell lines expressing entire or parts of hepatitis C virus open reading frame. Hepatology 36:1431–1438 - PubMed
    1. Ciccaglione AR, Marcantonio C, Tritarelli E, Tataseo P, Ferraris A, Bruni R, Dallapiccola B, Gerosolimo G, Costantino A, Rapicetta M. 2008. Microarray analysis identifies a common set of cellular genes modulated by different HCV replicon clones. BMC Genomics 9:309 doi:10.1186/1471-2164-9-309 - DOI - PMC - PubMed
    1. Pazienza V, Clement S, Pugnale P, Conzelmann S, Pascarella S, Mangia A, Negro F. 2009. Gene expression profile of Huh-7 cells expressing hepatitis C virus genotype 1b or 3a core proteins. Liver Int. 29:661–669 - PubMed
    1. Lindenbach BD, Evans MJ, Syder AJ, Wolk B, Tellinghuisen TL, Liu CC, Maruyama T, Hynes RO, Burton DR, McKeating JA, Rice CM. 2005. Complete replication of hepatitis C virus in cell culture. Science 309:623–626 - PubMed
    1. Wakita T, Pietschmann T, Kato T, Date T, Miyamoto M, Zhao Z, Murthy K, Habermann A, Krausslich HG, Mizokami M, Bartenschlager R, Liang TJ. 2005. Production of infectious hepatitis C virus in tissue culture from a cloned viral genome. Nat. Med. 11:791–796 - PMC - PubMed

Publication types

MeSH terms