. 2013 Jun;87(11):6469-81.
doi: 10.1128/JVI.03456-12. Epub 2013 Apr 3.

Three-dimensional architecture of tick-borne encephalitis virus replication sites and trafficking of the replicated RNA

Affiliations

Three-dimensional architecture of tick-borne encephalitis virus replication sites and trafficking of the replicated RNA

Lisa Miorin et al. J Virol. 2013 Jun.

Abstract

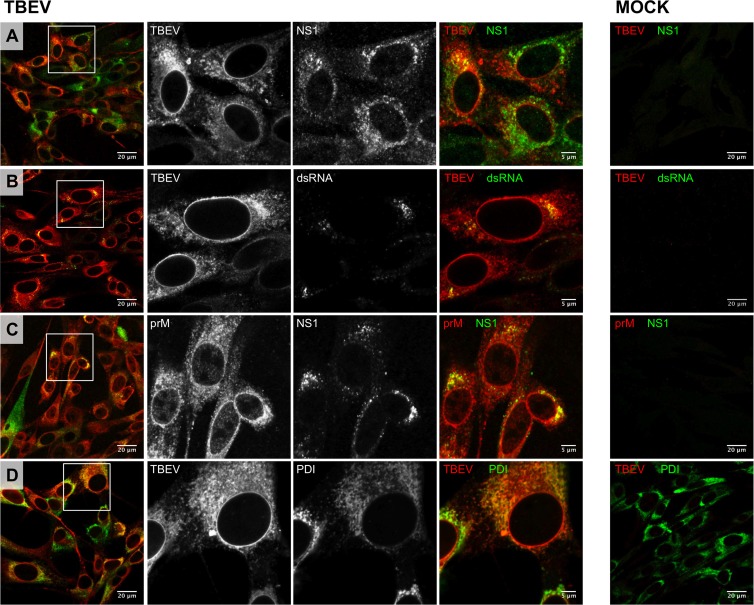
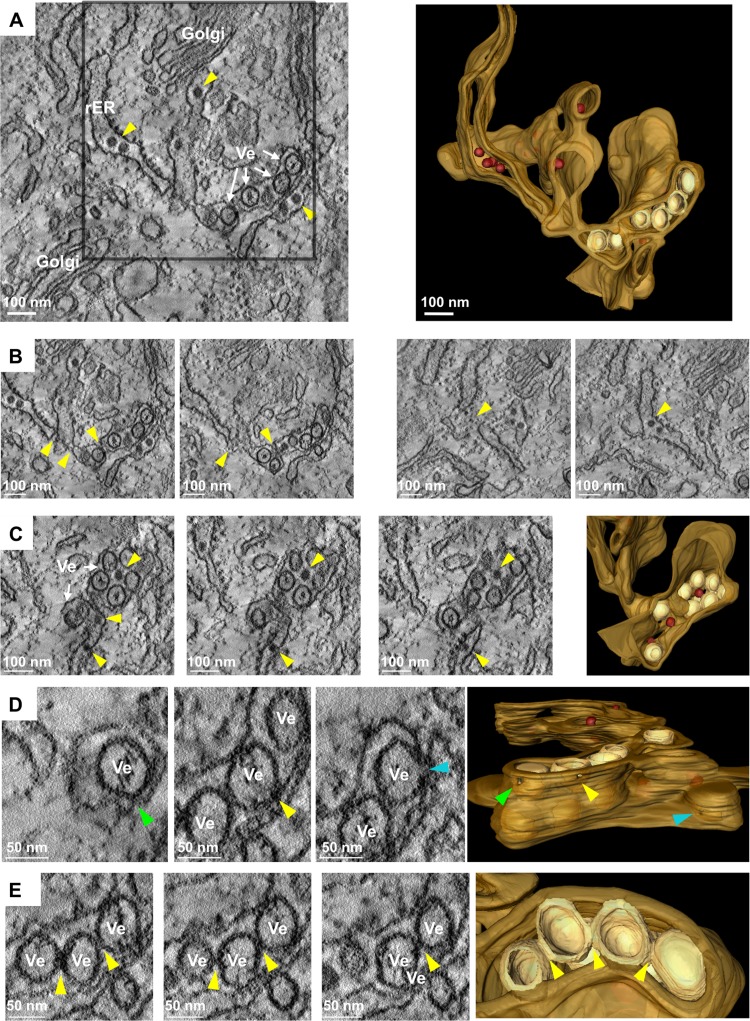
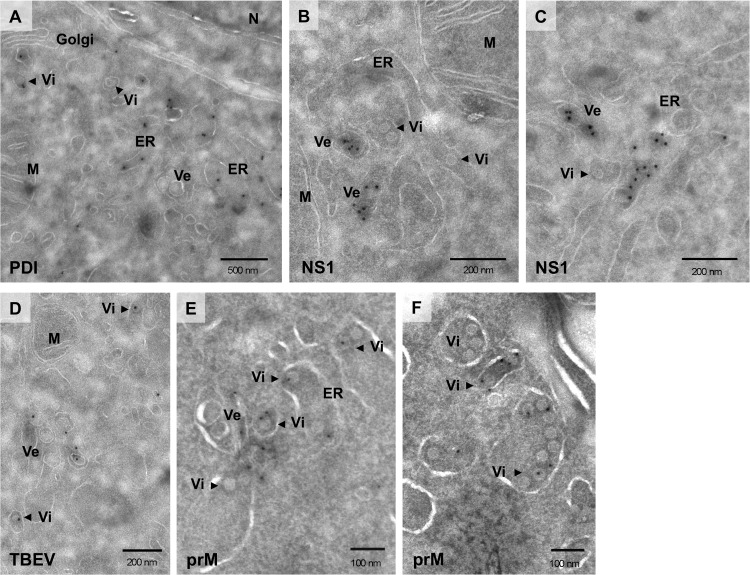
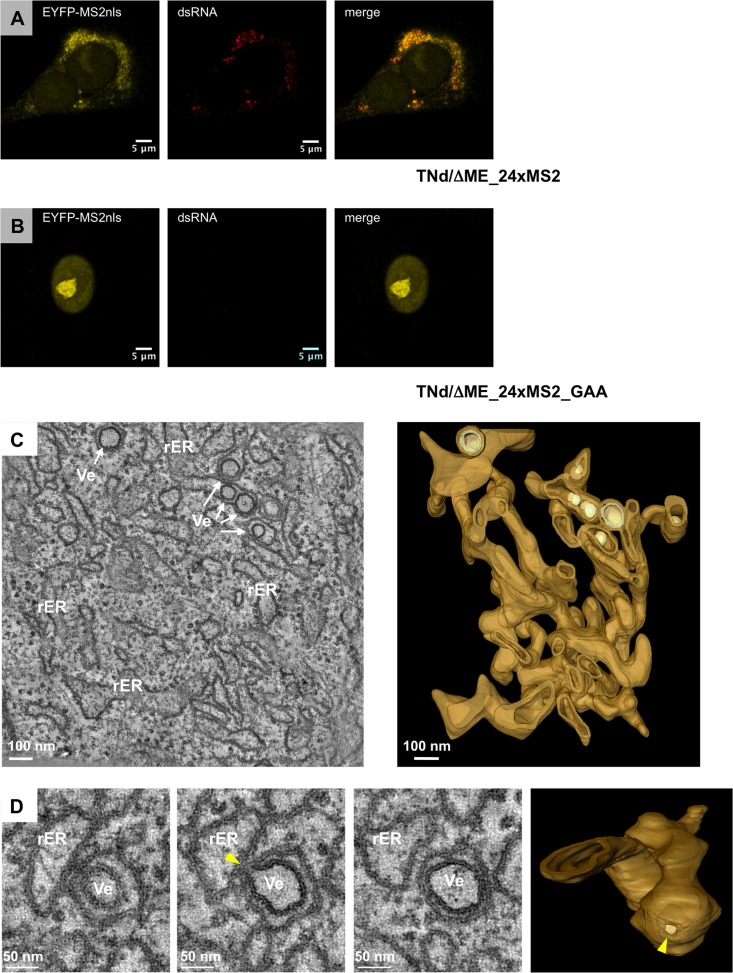
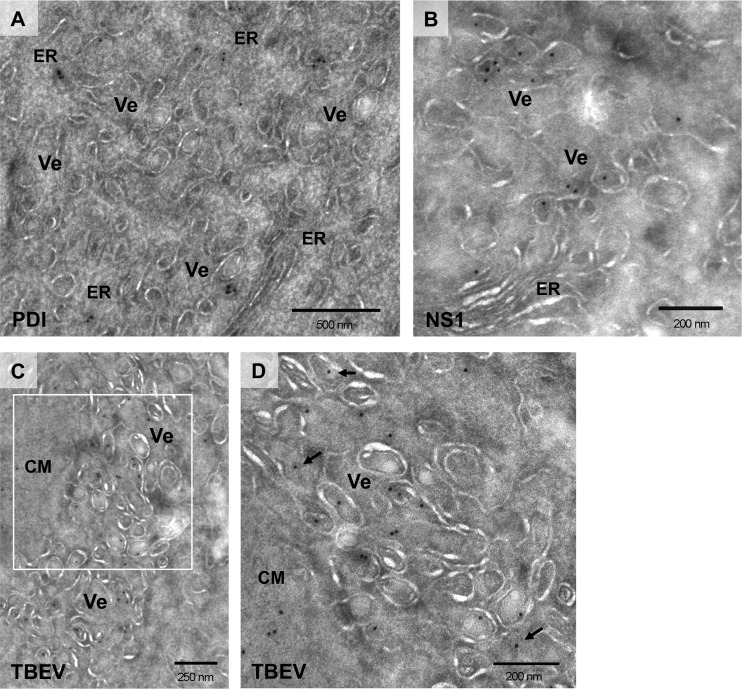
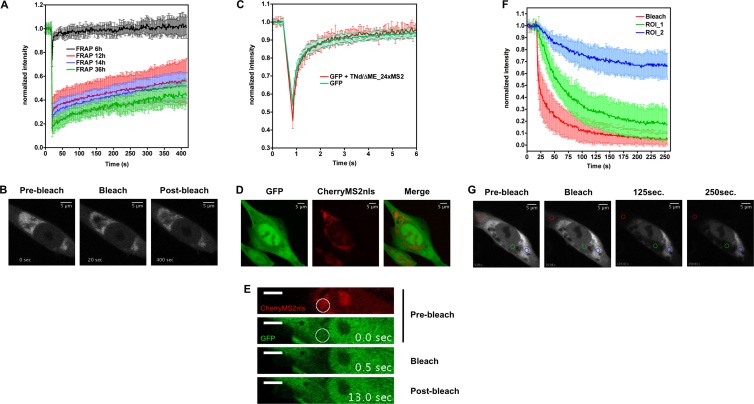
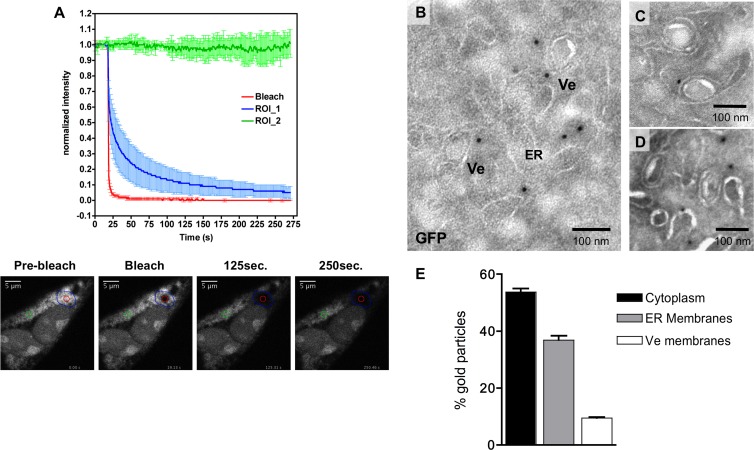
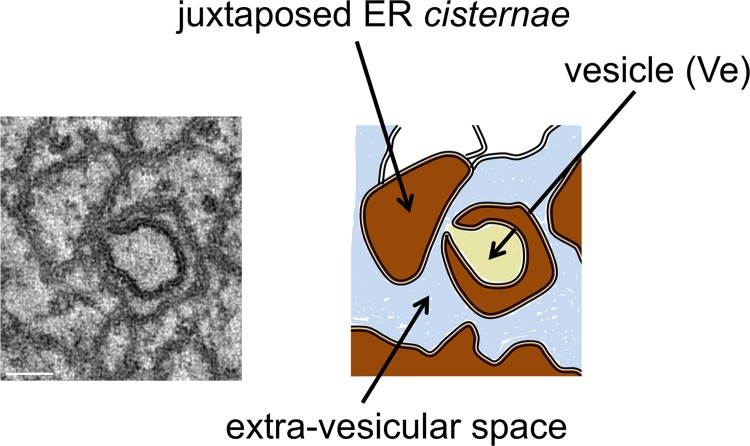
Flavivirus replication is accompanied by the rearrangement of cellular membranes that may facilitate viral genome replication and protect viral components from host cell responses. The topological organization of viral replication sites and the fate of replicated viral RNA are not fully understood. We exploited electron microscopy to map the organization of tick-borne encephalitis virus (TBEV) replication compartments in infected cells and in cells transfected with a replicon. Under both conditions, 80-nm vesicles were seen within the lumen of the endoplasmic reticulum (ER) that in infected cells also contained virions. By electron tomography, the vesicles appeared as invaginations of the ER membrane, displaying a pore that could enable release of newly synthesized viral RNA into the cytoplasm. To track the fate of TBEV RNA, we took advantage of our recently developed method of viral RNA fluorescent tagging for live-cell imaging combined with bleaching techniques. TBEV RNA was found outside virus-induced vesicles either associated to ER membranes or free to move within a defined area of juxtaposed ER cisternae. From our results, we propose a biologically relevant model of the possible topological organization of flavivirus replication compartments composed of replication vesicles and a confined extravesicular space where replicated viral RNA is retained. Hence, TBEV modifies the ER membrane architecture to provide a protected environment for viral replication and for the maintenance of newly replicated RNA available for subsequent steps of the virus life cycle.


Figures

Fig 1
Fig 1
Localization of TBEV proteins and dsRNA in BHK-21-infected cells. BHK-21 cells were either mock infected (MOCK; right) or infected with TBEV at an MOI of 2 (TBEV; left). After 24 h, cells were fixed and processed for immunofluorescence as described in Materials and Methods. (A) Cells costained with the anti-TBEV antiserum (TBEV; Alexa Fluor 594, red) and with the monoclonal anti-NS1 antibody (NS1; Alexa Fluor 488, green); (B) cells costained with the anti-TBEV antiserum (TBEV; Alexa Fluor 594, red) and with the J2 monoclonal anti-dsRNA antibody (dsRNA; Alexa Fluor 488, green); (C) cells costained with the anti-prM antiserum (prM; Alexa Fluor 594, red) and with the monoclonal anti-NS1 antibody (NS1; Alexa Fluor 488, green); (D) cells costained with the anti-TBEV antiserum (TBEV; Alexa Fluor 594, red) and with the anti-PDI monoclonal antibody (PDI; Alexa Fluor 488, green). The zoomed images shown in the middle panels correspond to boxed regions in the left panels.
Fig 2
Fig 2
Ultrastructural analysis of the membrane alterations induced by TBEV infection. (A) BHK-21 cells were infected with TBEV at an MOI of 2, fixed 24 hpi, and processed for ET as described in Materials and Methods. Left, tomographic slice of a dual-axis tomogram, shown in Movie S2 in the supplemental material. Upon infection, vesicles (Ve) and virions (yellow arrowheads) were observed in the lumen of the rough ER. Right, 3D surface reconstruction of the whole tomogram displaying the TBEV-induced vesicles (in light yellow) in the lumen of the ER (in light brown), as well as virions (in dark red). (B) Two examples (left and right) of tomographic slices through the whole tomogram depicting connections between ER tubules (yellow arrows). (C) Left, tomographic slices of the same dual-axis tomogram depicting several of these vesicles in the lumen of the ER in close proximity to newly assembled virions (yellow arrows), also observed in the Golgi apparatus (see Movie S1); right, 3D surface rendering of the same area displaying the TBEV-associated vesicles (in light yellow) sharing the ER lumen with TBE virions (in dark red) and surrounded by ER membranes (in light brown). (D) Left, serial single slices depicting openings of several TBEV-induced vesicles to the cytosol (green, yellow, and blue arrows); right, XZ view of the 3D reconstruction of the whole tomogram displaying these openings toward the cytosol (arrows with matching colors). (E) Left, slices through the tomogram showing tight contacts of TBEV-induced vesicles with their neighboring vesicles (yellow arrows); right, 3D reconstruction displaying these contacts between vesicles. Note that openings connecting vesicles were not observed in these tomograms.
Fig 3
Fig 3
Immunogold EM of TBEV-infected cells. BHK-21 cells were infected with TBEV at an MOI of 2 and fixed 24 hpi, and thawed cryosections were labeled with antibodies against PDI (A), NS1 (B and C), and prM (E and F) and with the anti-TBEV serum (D) that predominantly recognizes the structural protein E and the nonstructural protein NS1. Vesicles within the lumen of dilated ER cisternae (A) are specifically labeled with anti-NS1 (B and C) and anti-TBEV antibodies (D). Arrowheads in all panels highlight TBEV virions, specifically labeled with prM (E and F) and TBEV (D) antibodies, in the lumen of the ER or trafficking toward the Golgi apparatus. Abbreviations: M, mitochondria; N, nucleus; ER, endoplasmic reticulum; Ve, vesicles; Vi, virions.
Fig 4
Fig 4
Ultrastructural analysis of the membrane alterations induced by pTNd/ΔME_24×MS2. (A) BHK21-EYFP-MS2nls cells were electroporated with the TNd/ΔME_24×MS2 replicon RNA. Twenty-four hours postelectroporation (hpe), cells were fixed, permeabilized with Triton X-100, and incubated with an antibody against dsRNA that was then revealed by a secondary antibody conjugated with Alexa-594. The EYFP channel is shown in the left panel, dsRNA in the middle panel, and the merge in the right panel. (B) BHK21-EYFP-MS2nls cells were electroporated with the TNd/ΔME_24xMS2_GAA replicon RNA and treated as described for panel A. (C) BHK21-EYFP-MS2nls cells were electroporated with TNd/ΔME_24×MS2, fixed 24 hpe, and processed for ET as described in Materials and Methods. Left, slice of a dual-axis tomogram showing the TBEV-induced vesicles (Ve) in the ER lumen; right, 3D reconstruction of the complete tomogram. ER membranes are depicted in light brown and TBEV-induced vesicles in light yellow. This tomogram and its 3D membrane rendering are shown in Movie S4 in the supplemental material. (D) Left, serial single slices through the same tomogram displaying connections between adjacent ER tubules; right, 3D reconstruction of the whole tomogram showing a network of interconnected ER tubules. Note that the ER is highly fragmented in these cells in comparison to infected cells. (E) Left, serial single slices through the same tomogram displaying an opening toward the cytosol of a TBEV-induced vesicle (yellow arrows); right, 3D surface model showing this opening that connects the interior of the vesicle with the cytosol.
Fig 5
Fig 5
Immunogold EM of replicon-induced membrane alteration. BHK21-EYFP-MS2nls cells were electroporated with TNd/ΔME_24×MS2 and fixed 24 h after, and thawed cryosections were labeled with antibodies against PDI (A) and NS1 (B) and with the anti-TBEV serum (C and D). All images show TBEV-induced vesicles (Ve) that are specifically labeled with anti-NS1 (B) and anti-TBEV (C and D) antibodies. (D) Higher-magnification image of membrane alterations induced by replicon transfection corresponding to the boxed region in panel C. Vesicles (Ve) and convoluted membranes (CM) labeled with anti-TBEV antibodies are shown.
Fig 6
Fig 6
TBEV-replicated RNA is not freely diffusible in the cytoplasm. (A) Analysis of TBEV RNA dynamics by FRAP time course. BHK-21 cells were electroporated with the TNd/ΔME_24×MS2 replicon RNA together with a vector expressing EYFP-MS2. At the indicated time points postelectroporation, the fluorescence recovery of the EYFP-MS2 protein in the area of bleaching was analyzed. The graph shows values of fluorescence intensity normalized to the prebleach values and corrected for the loss of fluorescence due to the imaging procedure (34, 36, 55). Data represent the averages of acquisitions from at least 10 cells ± standard deviations. (B) Image sequence from a FRAP experiment performed in BHK-21 cells 14 h after electroporation (29.25 by 29.25 μm). The bright perinuclear region represents the subcellular compartment into which replicated viral RNA is clustered and where ROIs were drawn. Times were collected before bleaching (prebleach, 0 s), immediately after the bleaching (bleach, 20 s), and at 400 s after the bleaching event (postbleach). A movie is also available as supporting information (see Movie S5 in the supplemental material). (C) Analysis of GFP mobility within the replication compartment. BHK-21 cells were electroporated with a vector expressing CherryMS2nls, to mark the RC, and with a GFP-expressing plasmid (pEGFP-N1), both in the presence (red line, GFP and TNd/ΔME_24×MS2) and in the absence (green line, GFP) of the TBEV replicon RNA. After 24 h, GFP kinetics was investigated by FRAP. In the graph, the recovery curves of the GFP protein in the two different experimental conditions are compared. The values of fluorescence intensity are normalized to the prebleach values and corrected for the loss of fluorescence due to the imaging procedure as already described. Data represent the averages of acquisitions from 10 cells ± standard deviations. (D) Representative image of BHK-21 cells transfected with GFP and CherryMS2nls in the presence of the TBEV replicating RNA. A z-projection of 41 images 0.5 μm apart is shown. (E) Image sequence from the FRAP experiment described in panel C (36.56 by 7.14 μm). Top, prebleach stacks in both channels (0 s). The circle indicates the area of bleach chosen in the RC marked by CherryMS2nls. Middle, time point immediately after the bleaching event (0.5 s); bottom, postbleach stack (13 s). A video is also available as supporting information (see Movie S6 in the supplemental material). (F) BHK-21 cells were electroporated with the TNd/ΔME_24×MS2 replicon RNA together with a vector expressing EYFP-MS2. After 24 h, viral RNA release from the RC was monitored by FLIP. (G) Selected images from a FLIP experiment are shown (36.56 by 36.56 μm). The region for bleaching (red circle in the bottom panels) was chosen in the cytoplasm away from the clustered TBEV RNA. Loss of fluorescence was then measured in the cytoplasm both within (blue circle, ROI_1) and outside (green circle, ROI_2) the RC. In the top graph, the loss in fluorescence intensity within the three different ROIs (bleach; ROI_1 and ROI_2) is compared. Data are normalized as described for panel A and represent the averages of acquisitions from 10 cells ± standard deviations. A video is also available as supporting information (see Movie S7 in the supplemental material).
Fig 7
Fig 7
TBEV replication compartments are organized in discrete clusters. (A) BHK-21 cells were electroporated with the TNd/ΔME_24×MS2 replicon RNA and with the EYFP-MS2nls reporter. At 24 h after transfection, viral RNA trafficking within the RC was analyzed by FLIP. For this purpose, as shown in the bottom images (29.25 by 29.25 μm), the area of bleaching (red circle) was located inside the compartment. Loss of fluorescence was then measured in two different regions, one surrounding the bleaching area (blue region; ROI_1) and the other one more distant (green circle; ROI_2). The top panel compares the loss of fluorescence curves of the three selected ROIs. Data are normalized as already described and represent the average of acquisitions from 10 cells ± standard deviation. A video is also available as supporting information (see Movie S8 in the supplemental material). (B) BHK21-EYFP-MS2nls cells were electroporated with TNd/ΔME_24×MS2 and fixed 24 h after, and thawed cryosections were immunogold labeled with antibodies against GFP. Selected examples of the different situations are shown in panels C and D. (E) Quantification of GFP-labeled EM cryosections prepared as described in Fig. 7B. Counting was performed in triplicate, measuring the distribution of >100 gold particles for each grid. Data are plotted as percentages ± SD.
Fig 8
Fig 8
Model of TBEV-induced membrane alterations. Left, slice of the dual-axis tomogram shown in Fig. 4B; right, two-dimension schematic model of the possible organization of TBEV replication compartments. TBEV replication leads to the formation of a highly organized network of interconnected and juxtaposed ER membranes in the perinuclear region of the cells. This compartment is composed of vesicles (Ve; in light yellow) connected to the cytoplasm via pore-like channels, of dilated ER cisternae (in brown), and of a cytoplasmic extravesicular space (in light blue). Progeny viral RNAs are synthesized within the lumen of these ER invaginations and are then extruded through the pore into the cytoplasmic extravesicular space. Once released into this area, viral RNAs are available for downstream assembly into new viral particles that bud back into the lumen of ER cisternae of infected cells (Fig. 2). Alternatively, these RNAs may be engaged in further rounds of translation and replication.

Similar articles

Cited by

References

    1. Gritsun TS, Lashkevich VA, Gould EA. 2003. Tick-borne encephalitis. Antiviral Res. 57:129–146 - PubMed
    1. Lindquist L, Vapalahti O. 2008. Tick-borne encephalitis. Lancet 371:1861–1871 - PubMed
    1. Mansfield KL, Johnson N, Phipps LP, Stephenson JR, Fooks AR, Solomon T. 2009. Tick-borne encephalitis virus—a review of an emerging zoonosis. J. Gen. Virol. 90:1781–1794 - PubMed
    1. Gubler DJ, Kuno G, Markoff L. 2007. Flaviviruses, p 1153–1252 In Knipe DM, Howley PM, Griffin DE, Lamb RA, Martin MA. (ed), Fields virology, fifth ed Lippincott, Williams & Wilkins, Philadelphia, PA
    1. Lindenbach BD, Thiel HJ, Rice CM. 2007. Flaviviridae: the viruses and their replication, p 1101–1152 In Knipe DM, Howley PM, Griffin DE, Lamb RA, Martin MA. (ed), Fields virology, fifth ed Lippincott, Williams & Wilkins, Philadelphia, PA

Publication types

LinkOut - more resources