Vitrification preserves chromatin integrity, bioenergy potential and oxidative parameters in mouse embryos
- PMID: 23552480
- PMCID: PMC3652727
- DOI: 10.1186/1477-7827-11-27
Vitrification preserves chromatin integrity, bioenergy potential and oxidative parameters in mouse embryos
Abstract
Background: The aim of this study was to evaluate the effects of vitrification on morpho-functional parameters (blastomere/chromatin integrity and bioenergy/oxidative potential) of mouse preimplantation embryos.
Methods: In vivo produced mouse (4/16-cell, morulae and blastocyst-stage) embryos were randomly divided into vitrification and control groups. For vitrification, embryos were exposed to a 2-step loading of ethylene glycol and propylene glycol, before being placed in a small nylon loop and submerged into liquid nitrogen. After warming, the cryoprotectants were diluted by a 3-step procedure. Embryo morphology, chromatin integrity and energy/oxidative status were compared between groups.
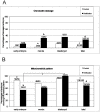
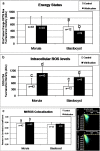
Results: Vitrification induced low grade blastomere cytofragmentation (P < 0.05) and low chromatin damage only in embryos at the morula stage (P < 0.001). Mitochondrial (mt) distribution pattern was affected by vitrification only in early embryos (P < 0.001). Mitochondrial activity did not change upon vitrification in morula-stage embryos but it was reduced in blastocyst-stage embryos (P < 0.05). Intracellular ROS levels significantly increased in embryos at the morula and blastocyst stages (P < 0.001). Colocalization of active mitochondria and ROS increased only in vitrified blastocysts.
Conclusions: In conclusion, this study elucidates the developmentally-related and mild effects of vitrification on morphology, nuclear and bioenergy/oxidative parameters of mouse embryos and demonstrates that vitrification is a suitable method for preserving predictive parameters of embryo ability to induce a full-term pregnancy.
Figures


Similar articles
-
Different chromatin and energy/redox responses of mouse morulae and blastocysts to slow freezing and vitrification.Reprod Biol Endocrinol. 2015 Mar 24;13:22. doi: 10.1186/s12958-015-0018-z. Reprod Biol Endocrinol. 2015. PMID: 25889099 Free PMC article.
-
Vitrification of mouse embryos at various stages by open-pulled straw (OPS) method.Anim Biotechnol. 2005;16(2):153-63. doi: 10.1080/10495390500263831. Anim Biotechnol. 2005. PMID: 16335809
-
Evaluation of post-transfer fertility of vitrified goat morulae and blastocysts using an innovative protocol in micropipette tips.Cryobiology. 2025 Jun;119:105234. doi: 10.1016/j.cryobiol.2025.105234. Epub 2025 Mar 20. Cryobiology. 2025. PMID: 40117951
-
Cryopreservation of animal and human embryos by vitrification.Reprod Biomed Online. 2004 Aug;9(2):164-70. doi: 10.1016/s1472-6483(10)62125-6. Reprod Biomed Online. 2004. PMID: 15333245 Review.
-
The movement of water and cryoprotectants across the plasma membrane of mammalian oocytes and embryos and its relevance to vitrification.J Reprod Dev. 2016 Aug 25;62(4):317-21. doi: 10.1262/jrd.2016-048. Epub 2016 May 19. J Reprod Dev. 2016. PMID: 27193425 Free PMC article. Review.
Cited by
-
Effect of vitrification versus slow freezing of human day 3 embryos on β-hCG levels.J Assist Reprod Genet. 2014 Aug;31(8):1037-43. doi: 10.1007/s10815-014-0259-3. Epub 2014 Jun 1. J Assist Reprod Genet. 2014. PMID: 24880883 Free PMC article.
-
Transcriptomic difference in bovine blastocysts following vitrification and slow freezing at morula stage.PLoS One. 2017 Nov 2;12(11):e0187268. doi: 10.1371/journal.pone.0187268. eCollection 2017. PLoS One. 2017. PMID: 29095916 Free PMC article.
-
Ochratoxin A affects oocyte maturation and subsequent embryo developmental dynamics in the juvenile sheep model.Mycotoxin Res. 2021 Feb;37(1):23-37. doi: 10.1007/s12550-020-00410-y. Epub 2020 Sep 29. Mycotoxin Res. 2021. PMID: 32996062 Free PMC article.
-
Effects of low-dose X-ray medical diagnostics on female gonads: Insights from large animal oocytes and human ovaries as complementary models.PLoS One. 2021 Jun 24;16(6):e0253536. doi: 10.1371/journal.pone.0253536. eCollection 2021. PLoS One. 2021. PMID: 34166427 Free PMC article.
-
Transcriptomic Analysis of Vitrified-Warmed vs. Fresh Mouse Blastocysts: Cryo-Induced Physiological Mechanisms and Implantation Impact.Int J Mol Sci. 2024 Aug 8;25(16):8658. doi: 10.3390/ijms25168658. Int J Mol Sci. 2024. PMID: 39201343 Free PMC article.
References
-
- Fuller B, Paynter S, Watson P. In: Life in the frozen state. Fuller B, Lane N, Benson E, editor. Boca Raton: CRC Press; 2004. Cryopreservation of human gametes and embryos; pp. 505–541.
-
- Vajta G. Vitrification of oocytes and embryos of domestic animals. Anim Reprod Sci. 2000;60–61:357–364. - PubMed
Publication types
MeSH terms
Substances
LinkOut - more resources
Full Text Sources
Other Literature Sources

