. 2012 Apr 16;1(4):e7.
doi: 10.1038/oncsis.2012.7.

The CEACAM1 tumor suppressor is an ATM and p53-regulated gene required for the induction of cellular senescence by DNA damage

Affiliations

The CEACAM1 tumor suppressor is an ATM and p53-regulated gene required for the induction of cellular senescence by DNA damage

A-P Sappino et al. Oncogenesis. .

Abstract

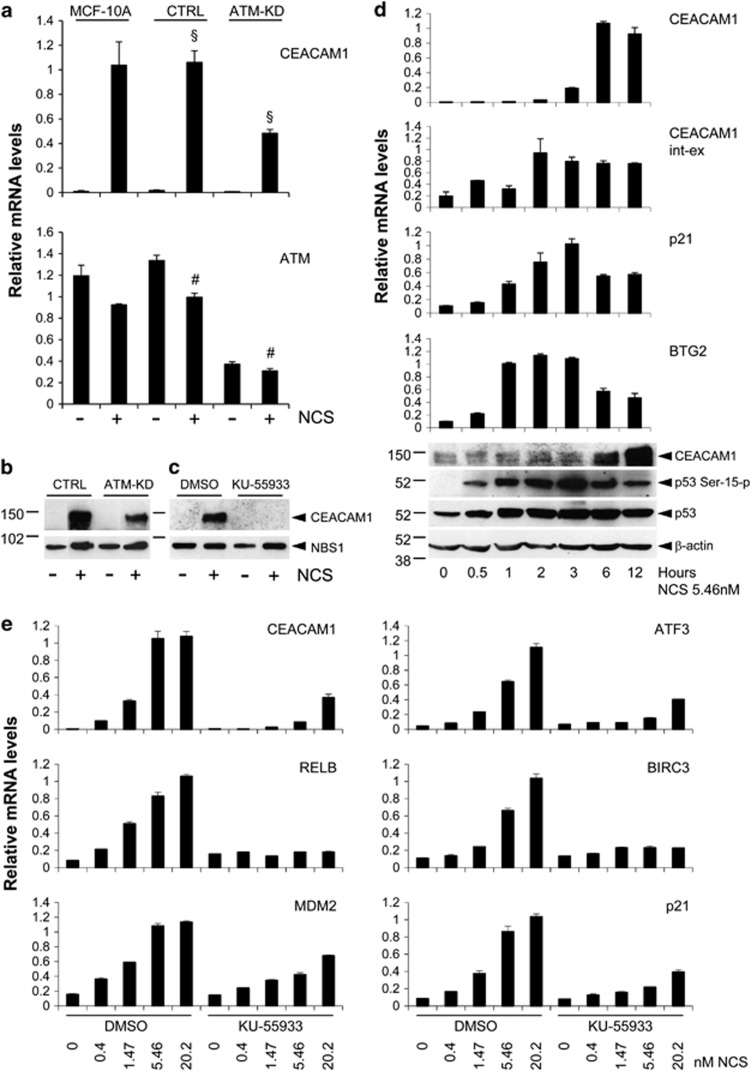
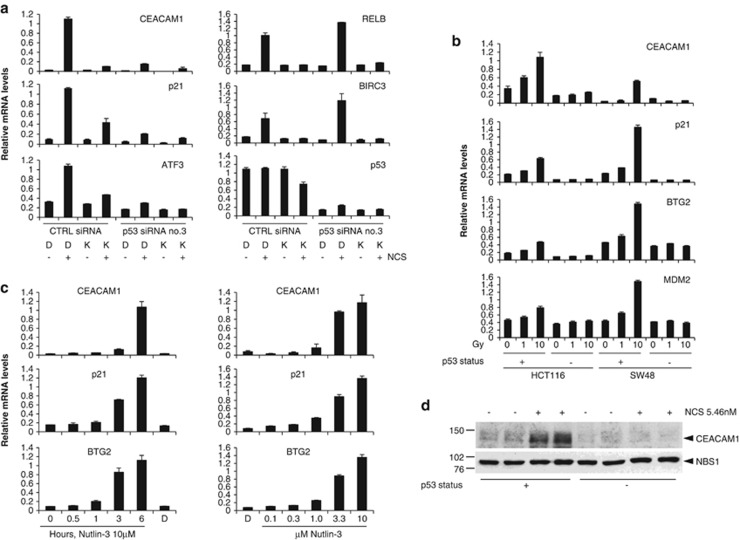
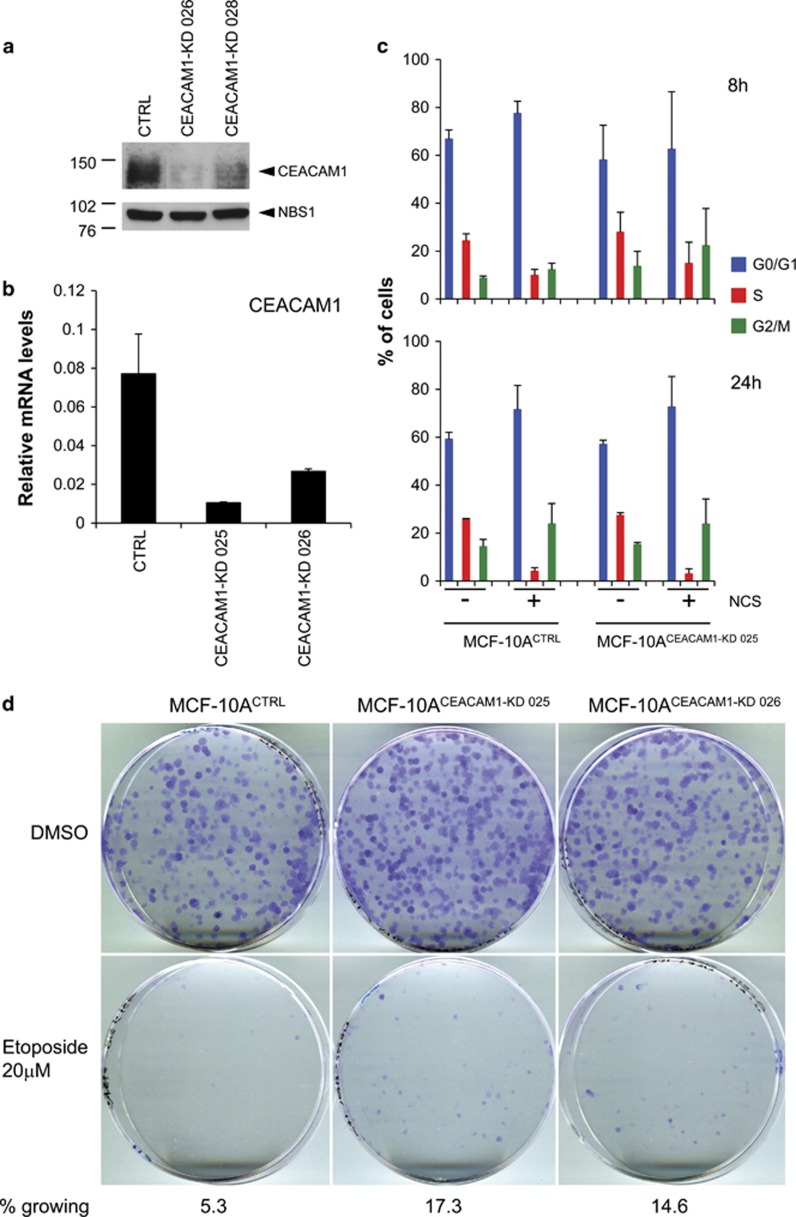
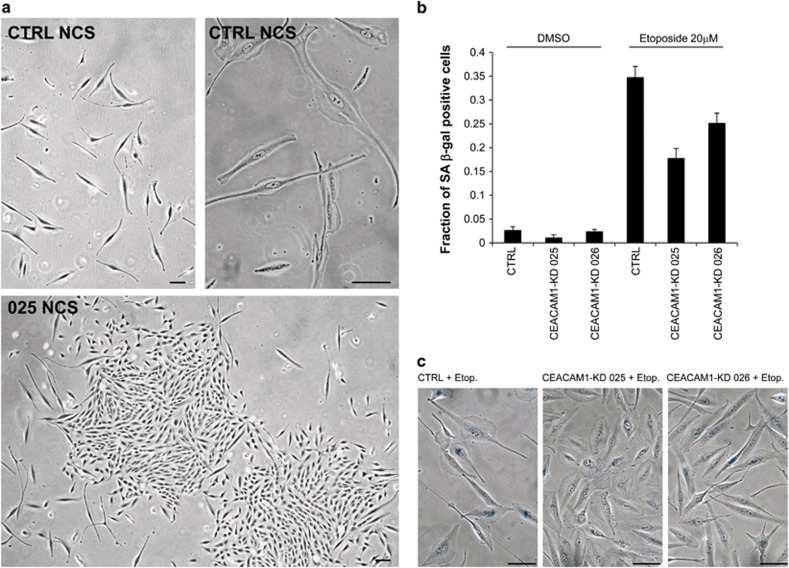
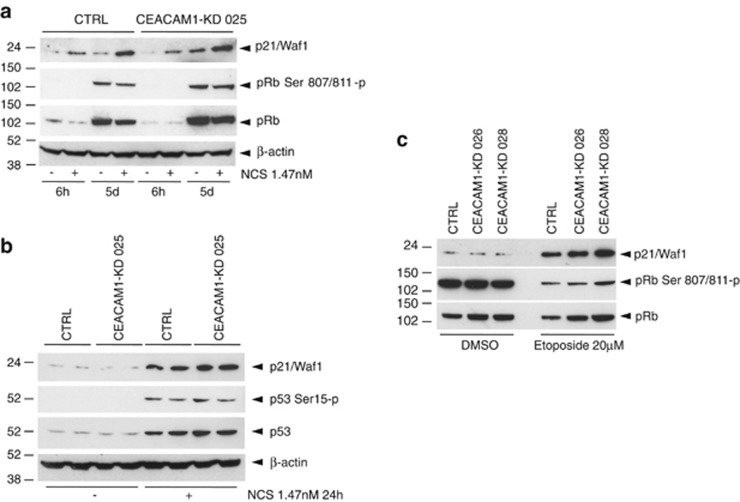
The p53 tumor-suppressor protein has a key role in the induction of cellular senescence, an important barrier to cancer development. However, very little is known about the physiological mediators of cellular senescence induced by p53. CEACAM1 is an immunoglobulin superfamily member whose expression is frequently lost in human tumors and exhibits tumor-suppressor features in several experimental systems, including Ceacam1 knockout mice. There is currently little understanding of the pathways and mechanisms by which CEACAM1 exerts its tumor-suppressor function. Here we report that CEACAM1 is strongly upregulated during the cellular response to DNA double-strand breaks (DSBs) starting from the lowest doses of DSB inducers used, and that upregulation is mediated by the ataxia telangiectasia mutated (ATM)/p53 pathway. Stable silencing of CEACAM1 showed that CEACAM1 is required for p53-mediated cellular senescence, but not initial cell growth arrest, in response to DNA damage. These findings identify CEACAM1 as a key component of the ATM/p53-mediated cellular response to DNA damage, and as a tumor suppressor mediating cellular senescence downstream of p53.


Figures

Figure 1
Figure 1
CEACAM1 is upregulated by NCS in an ATM-dependent manner. (a) Parental MCF-10A cells (MCF-10A) or MCF-10A cells stably expressing an ATM shRNA vector (ATM-KD) or a scrambled shRNA vector (CTRL) as a control were incubated for 4 h in the presence or the absence of 20 nM NCS. At the end of the incubation, total RNA was extracted and analyzed for the levels of CEACAM1 or ATM expression by quantitative real-time PCR. The values in the graph represent the mean±s.e.m. from three independent experiments. §P<0.005; #P<0.001. (b) MCF-10A cells stably expressing an ATM shRNA vector (ATM-KD) or a scrambled shRNA (CTRL) were incubated for 16 h in the presence or the absence of 5.46 nM NCS. At the end of the incubation, total proteins were extracted and analyzed for the levels of CEACAM1 or Nijmegen breakage syndrome 1 (NBS1) expression by western blotting. (c) Parental MCF-10A cells were incubated for 1 h in the presence of 10 μM KU-55933 or the same dilution of dimethyl sulfoxide (DMSO (solvent)) as a control, followed by 16 h incubation in the presence or the absence of NCS 5.46 nM. At the end of the incubation, total proteins were extracted and analyzed for the levels of CEACAM1 or NBS1 expression by western blotting. In b and c, numbers on the left indicate kDa. (d) MCF-10A cells were incubated in the presence of 5.46 nM NCS for the times indicated. At the end of the incubation, the cells were split into two parts and either processed for protein extraction or for total RNA purification. RNAs were analyzed for the levels of CEACAM1, CEACAM1 primary transcript (CEACAM1 int-ex), p21/Waf1 or BTG2 by quantitative real-time PCR in triplicates. Error bars indicate s.d. within the internal replicates. Proteins were analyzed for the levels of CEACAM1, p53 Ser 15-p, p53 or β-actin (lower panel). Numbers on the left indicate kDa. (e) MCF-10A cells were incubated for 1 h in the presence of 10 μM KU-55933 or the same volume of DMSO (solvent) as a control, followed by 4 h in the presence of the indicated concentrations of NCS. At the end of the incubation total RNAs were purified and analyzed for the levels of the indicated genes by quantitative real-time PCR in triplicates. Error bars indicate s.d. within the internal replicates.
Figure 2
Figure 2
Induction of CEACAM1 by NCS or X-Rays in MCF-10A, HCT116 or SW48 cells is dependent on p53. (a) MCF-10A cells were transfected with p53 siRNA no.3 or a control (CTRL) siRNA as indicated. Two days later, 10 μM KU-55933 (K) or dimethyl sulphoxide (DMSO) (D) (solvent) was added. One hour later the cells were incubated in the presence or the absence of 20 nM NCS as indicated for an additional 4 h. At the end of the incubation total RNAs were purified and analyzed for the levels of the indicated genes by quantitative real-time PCR in triplicates. Error bars indicate s.d. within the internal replicates. (b) HCT116 or SW48 cells with wild type or inactivated p53 were irradiated with the indicated doses of X-rays and incubated at 37 °C for 6 h. At the end of the incubation total RNAs were purified and analyzed for the levels of the indicated genes by quantitative real-time PCR in triplicates. Error bars indicate s.d. within the internal replicates. (c) MCF-10A cells were incubated for the indicated times in the presence of 10 μM nutlin-3, or for 6 h in the presence of DMSO (D) (solvent) (left) or for 6 h in the presence of the indicated concentrations of nutlin-3 or the same volume of DMSO (D) (right). At the end of the incubation total RNAs were purified and analyzed for the levels of the indicated genes by quantitative real-time PCR in triplicates. Error bars indicate s.d. within the internal replicates. (d) HCT116 cells with wild type or inactivated p53 were incubated in the presence or the absence of NCS 5.46 nM for 16 h in duplicate as indicated. At the end of the incubation the cells were lysed and analysed for the levels of CEACAM1 or NBS1 by western blotting.
Figure 3
Figure 3
Establishment and phenotype of MCF-10A cells or HCT116 cells with stable silencing of CEACAM1. (a) HCT116 cells stably transfected with CEACAM1 shRNA vector no. 26 (CEACAM1-KD 026), with CEACAM1 shRNA vector no. 28 (CEACAM1-KD 028) or with a control shRNA vector (CTRL) were lysed and analyzed for CEACAM1 or NBS1 expression levels by western blotting. One of two experiments with similar results is shown. (b) MCF-10A cells stably transfected with CEACAM1 shRNA vector no. 25 (CEACAM1-KD 025), with CEACAM1 shRNA vector no. 26 (CEACAM1-KD 026) or with a control shRNA vector (CTRL) were analyzed for CEACAM1 mRNA levels by quantitative real-time PCR. Error bars indicate s.d.; n=2. (c) MCF-10A cells stably transfected with CEACAM1 shRNA vector no. 25 (MCF10ACEACAM1−KD 025) or with a control shRNA vector (MCF10ACTRL) were incubated in the presence or the absence of NCS 1.47 nM for the indicated time points, labeled with BrdU (10 μM, 20 min), fixed with ice-cold ethanol and treated for analysis of the cell cycle phase distribution by flow cytometry using a FACSCalibur apparatus (Becton-Dickinson Biosciences, Le Pont-De-Claix Cedex, France). At least 104 events were recorded and data analysis was done with CellQuest Pro software (Becton-Dickinson Biosciences). (d) MCF-10A cells stably transfected with CEACAM1 shRNA vector no. 25 (CEACAM1-KD 025), with CEACAM1 shRNA vector no. 26 (CEACAM1-KD 026) or with a control shRNA vector (CTRL) were seeded in 60 mm Petri dishes at the density of 1500 cells/dish. On the following day the cells were treated with the indicated dose of etoposide for 1 h, washed with phosphate-buffered saline, and allowed to grow in new medium at 37 °C. After 7 days, the colonies were fixed with methanol, stained with crystal violet, and counted.
Figure 4
Figure 4
CEACAM1 is required for the establishment of cellular senescence as assessed by cellular morphology and senescence-associated β-galactosidase staining. (a) MCF-10A cells stably transfected with CEACAM1 shRNA vector no. 25 (025) or with a control shRNA vector (CTRL) were seeded in 60 mm Petri dishes at the density of 16 000 cells/dish. On the following day the cells were treated with NCS 1.47 nM. After 6 days, the cells were photographed under phase contrast. Bar =100 μm. (b) MCF-10A cells stably transfected with CEACAM1 shRNA vector no. 25 (CEACAM1-KD 025), with CEACAM1 shRNA vector no. 26 (CEACAM1-KD 026) or with a control shRNA vector (CTRL) were seeded in 6-well plates at the density of 50 000 cells/well in triplicates. On the following day the cells were treated with the indicated dose of etoposide for 1 h, washed with phosphate-buffered saline, and allowed to grow in new medium at 37 °C. After 4 days, the cells were stained for senescence-associated (SA) β-galactosidase. The graph represents the fraction of SA β-galactosidase positive cells ±s.e.m. in 15 randomly selected photographic fields where a total of at least 250 cells from two different experiments/condition were counted. p CEACAM1-KD 025 + etoposide vs CTRL + etoposide <0.001; p CEACAM1-KD 026 + etoposide vs CTRL + etoposide =0.005. Two-sided t-test. (c) Examples of the (SA) β-galactosidase staining of MCF-10ACTRL, MCF-10ACEACAM1−KD 025, or MCF-10ACEACAM1−KD 026 cells treated with Etoposide as detailed and quantified in b. Bar =100 μm.
Figure 5
Figure 5
MCF-10A and HCT116 cells with stable silencing of CEACAM1 exhibit normal regulation of p21/pRb in response to DNA damage. (a) MCF-10A cells stably transfected with CEACAM1 shRNA vector no. 25 (CEACAM1-KD 025) or with a control shRNA vector (CTRL) were incubated in the presence or the absence of 1.47 nM NCS for the indicated time points, lysed, and analyzed for p21/Waf1, pRb Ser 807/811-p, pRb, or β-actin by western blotting. (b) MCF-10A cells stably transfected with CEACAM1 shRNA vector no. 25 (CEACAM1-KD 025) or with a control shRNA vector (CTRL) were incubated in the presence or the absence of NCS 1.47 nM for 24 h in duplicate as indicated, lysed, and analyzed for p21/Waf1, pSer15-p, p53, or β-actin by western blotting. (c) HCT116 cells stably transfected with CEACAM1 shRNA vector no. 26 (CEACAM1-KD 026), with CEACAM1 shRNA vector no. 28 (CEACAM1-KD 028) or with a control shRNA vector (CTRL) were incubated in the presence of 20 μM etoposide or dimethyl sulfoxide (DMSO (solvent)) for 1 h, washed with phosphate-buffered saline and incubated in new medium for 3 days. At the end of the incubation the cells were lysed and analyzed for p21/Waf1, pRb Ser 807/811-p or pRb by western blotting.

Similar articles

Cited by

References

    1. Kuespert K, Pils S, Hauck CR. CEACAMs: their role in physiology and pathophysiology. Curr Opin Cell Biol. 2006;18:565–571. - PMC - PubMed
    1. Nouvion AL, Beauchemin N. CEACAM1 as a central modulator of metabolism, tumor progression, angiogenesis and immunity] Med Sci. 2009;25:247–252. - PubMed
    1. Mandriota SJ, Buser R, Lesne L, Stouder C, Favaudon V, Maechler P, et al. Ataxia telangiectasia mutated (ATM) inhibition transforms human mammary gland epithelial cells. J Biol Chem. 2010;285:13092–13106. - PMC - PubMed
    1. Renwick A, Thompson D, Seal S, Kelly P, Chagtai T, Ahmed M, et al. ATM mutations that cause ataxia-telangiectasia are breast cancer susceptibility alleles. Nat Genet. 2006;38:873–875. - PubMed
    1. Gorgoulis VG, Halazonetis TD. Oncogene-induced senescence: the bright and dark side of the response. Curr Opin Cell Biol. 2010;22:816–827. - PubMed