. 2013 Jun;24(11):1661-75, S1-11.
doi: 10.1091/mbc.E12-12-0908. Epub 2013 Apr 3.

β1 integrin regulates Arg to promote invadopodial maturation and matrix degradation

Affiliations

β1 integrin regulates Arg to promote invadopodial maturation and matrix degradation

Brian T Beaty et al. Mol Biol Cell. 2013 Jun.

Abstract

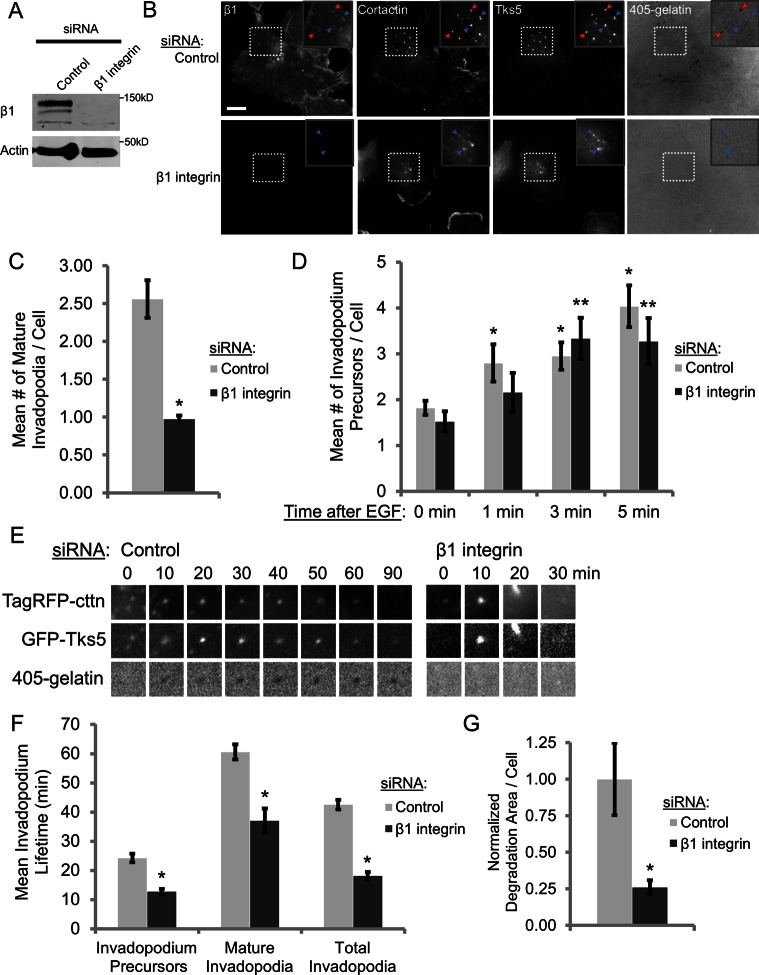
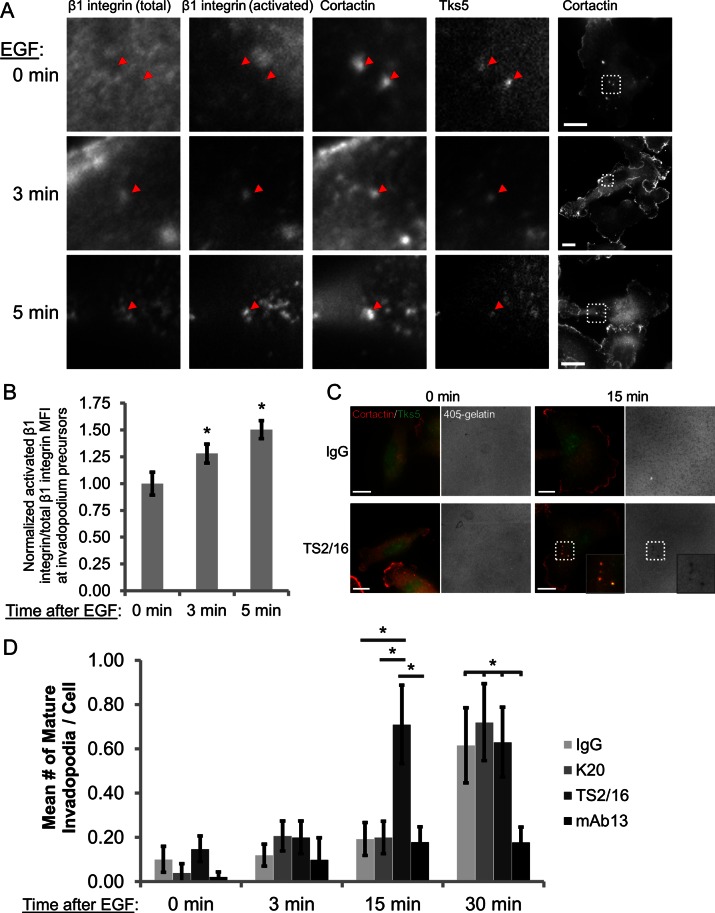
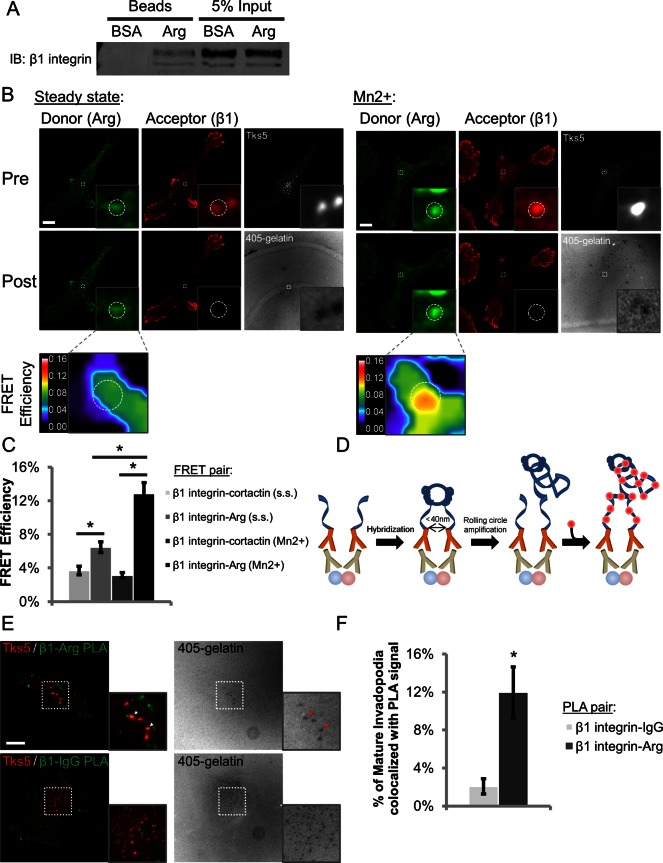
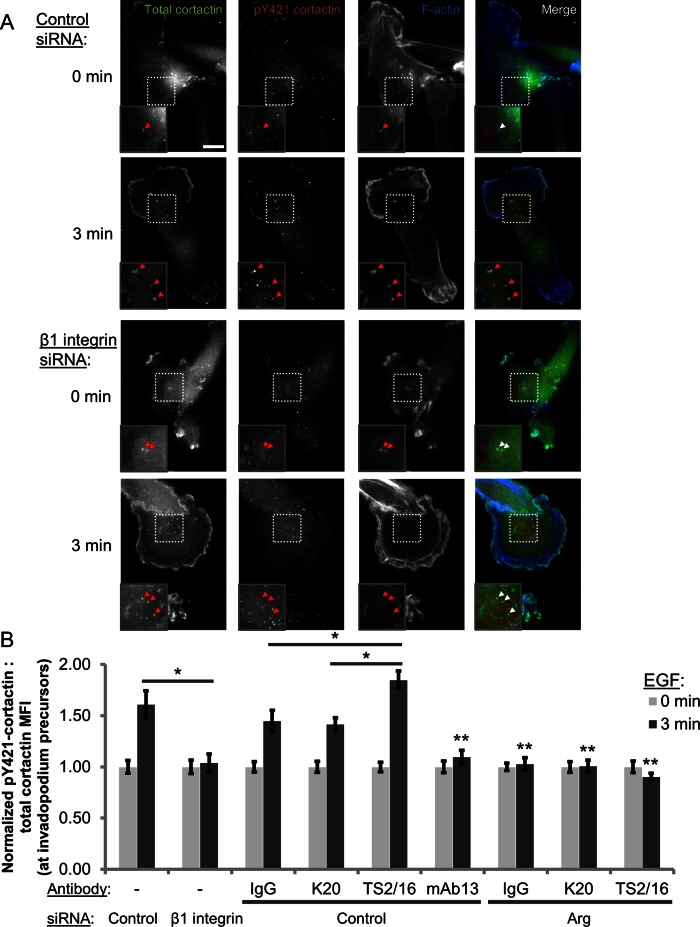
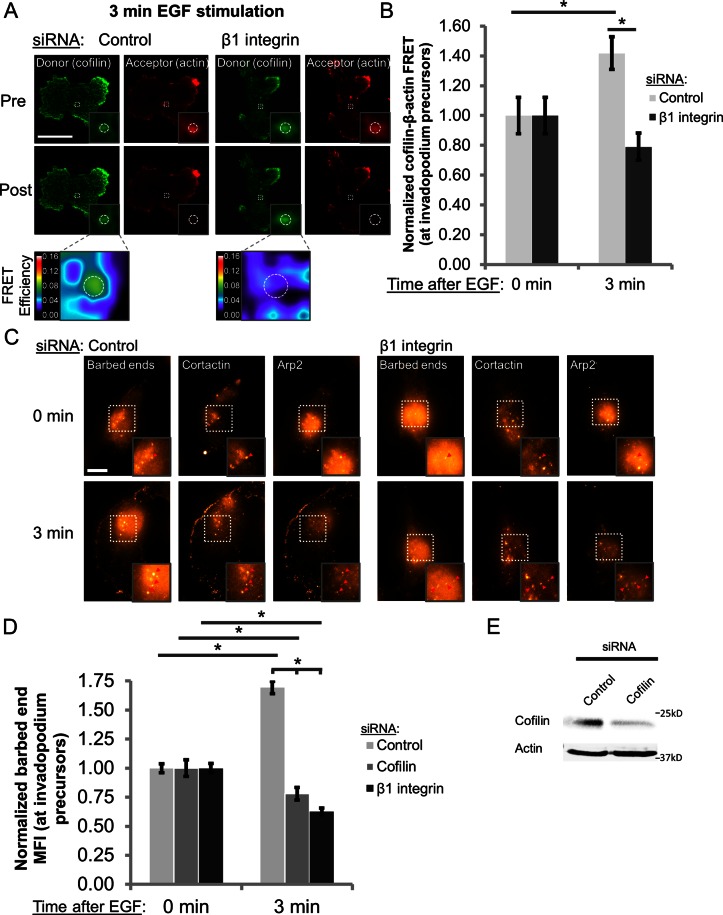
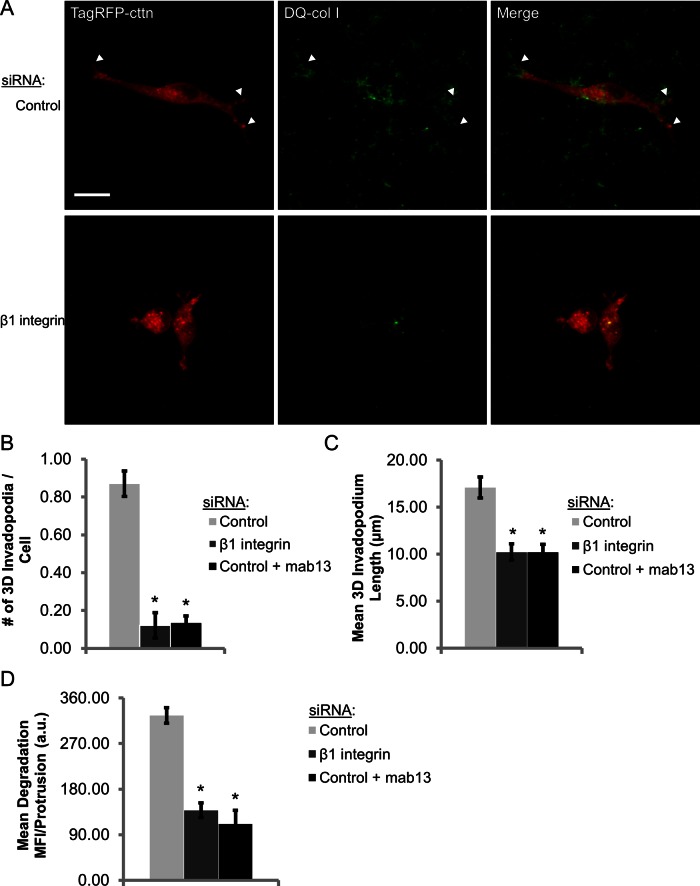
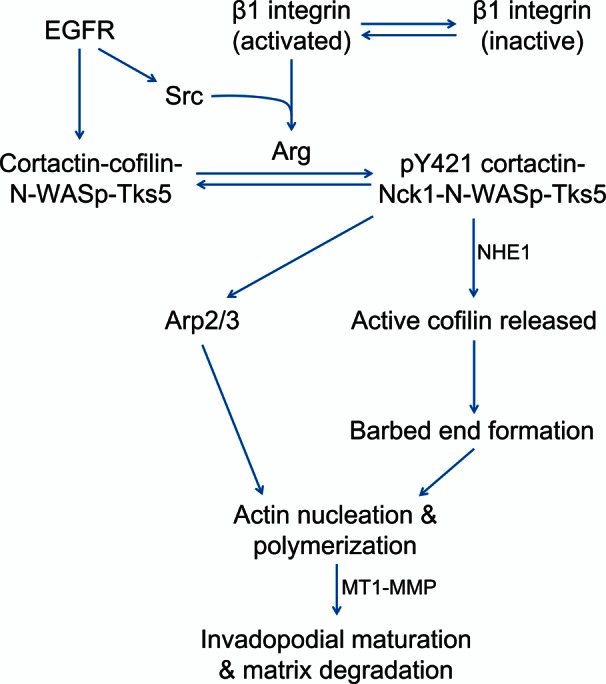
β1 integrin has been shown to promote metastasis in a number of tumor models, including breast, ovarian, pancreatic, and skin cancer; however, the mechanism by which it does so is poorly understood. Invasive membrane protrusions called invadopodia are believed to facilitate extracellular matrix degradation and intravasation during metastasis. Previous work showed that β1 integrin localizes to invadopodia, but its role in regulating invadopodial function has not been well characterized. We find that β1 integrin is required for the formation of mature, degradation-competent invadopodia in both two- and three-dimensional matrices but is dispensable for invadopodium precursor formation in metastatic human breast cancer cells. β1 integrin is activated during invadopodium precursor maturation, and forced β1 integrin activation enhances the rate of invadopodial matrix proteolysis. Furthermore, β1 integrin interacts with the tyrosine kinase Arg and stimulates Arg-dependent phosphorylation of cortactin on tyrosine 421. Silencing β1 integrin with small interfering RNA completely abrogates Arg-dependent cortactin phosphorylation and cofilin-dependent barbed-end formation at invadopodia, leading to a significant decrease in the number and stability of mature invadopodia. These results describe a fundamental role for β1 integrin in controlling actin polymerization-dependent invadopodial maturation and matrix degradation in metastatic tumor cells.


Figures

FIGURE 1:
FIGURE 1:
β1 integrin is required for invadopodial maturation, stability, and matrix degradation but not precursor formation. (A) Western blot analysis of MDA-MB-231 cells transfected with control or β1 integrin siRNA (SMARTpool) for 96 h. Blots were stained for β1 integrin and β-actin (loading control). (B, C) Steady-state invadopodial matrix degradation assay: MDA-MB-231 cells were plated on Alexa 405–labeled gelatin for 4 h. (B) Representative images of β1 integrin (C27), cortactin (sc-30771), and Tks5 staining. Red arrowheads denote mature invadopodia; blue arrowheads denote invadopodium precursors. Inset, magnified image of invadopodia in the box. Bar, 10 μm. (C) Quantification of mature invadopodia formed by control or β1 integrin siRNA (SMARTpool)–treated cells in the steady-state invadopodial matrix degradation assay. Mature invadopodia were scored as cortactin-Tks5–rich structures that colocalize with a degradation hole in Alexa 405–labeled gelatin. n > 100 cells; three independent experiments. *p < 0.0025 compared with control siRNA. (D) Invadopodium precursor formation assay: quantification of the number of cortactin- and Tks5-rich invadopodium precursors formed in MDA-MB-231 cells stimulated with EGF for 0 (untreated), 1, 3, or 5 min. Precursors were scored as punctate cortactin-Tks5–rich structures that do not colocalize with a degradation hole in Alexa 405–labeled gelatin. n > 45 cells; three independent experiments. *p < 0.017 compared with control siRNA 0 min; **p < 0.007 compared with β1 integrin siRNA 0 min. (E, F) TagRFP-cortactin– and GFP-Tks5–expressing control and β1 integrin–knockdown cells were plated on Alexa 405–labeled gelatin and imaged by time-lapse microscopy for 3 h. (E) Representative images of a TagRFP-cortactin– and GFP-Tks5–rich mature invadopodium formed by a control cell and a short-lived, invadopodium precursor formed by β1 integrin–depleted cells (see Supplemental Movies S1 and S2). Box, 3.85 μm. (F) Quantification of invadopodium lifetimes in control and β1 integrin siRNA (SMARTpool)–treated cells generated from time-lapse movies. n > 250 invadopodia; n > 22 cells; three independent experiments. *p < 0.0002 compared with control siRNA. (G) Quantification of invadopodial degradation area/field in the steady-state invadopodial matrix degradation assay normalized to the number of cells/field. *p < 0.003 compared with control siRNA.
FIGURE 2:
FIGURE 2:
β1 integrin is activated in invadopodium precursors, and stimulation of β1 integrin–mediated adhesion accelerates invadopodial maturation in EGF-stimulated cells. (A, B) MDA-MB-231 cells were stimulated with EGF, fixed, and stained with antibodies against total β1 integrin (P5D2), activated β1 integrin (9EG7), cortactin, and Tks5. (A) Representative images of activated β1 integrin staining at 0 min (untreated) and 3 and 5 min after EGF stimulation. The four leftmost panels show insets of the box on the far right. Arrowheads denote invadopodium precursors containing cortactin and Tks5. Bar, 10 μm. (B) Quantification of the ratio of activated β1 integrin:total β1 integrin MFI at the core of invadopodium precursors. n > 39 invadopodium precursors; n > 122 cells; three independent experiments. *p < 0.05 compared with 0 min. (C, D) Invadopodium maturation assay. MDA-MB-231 cells were plated on Alexa 405–labeled gelatin, pretreated with IgG, K20 β1 integrin antibody (nonactivating), TS2/16 β1 integrin antibody (activating), or mAb13 β1 integrin antibody (blocking) and stimulated with EGF for 0, 3, 15, or 30 min. (C) Representative merged images of cortactin- and Tks5-rich invadopodia formed by cells pretreated with IgG or TS2/16 and then stimulated with EGF for 0 or 15 min. Inset, magnified image of invadopodia in the box. Bar, 10 μm. (D) Quantification of cortactin- and Tks5-rich mature invadopodia at each time point. n > 40 cells; three independent experiments. *p < 0.047.
FIGURE 3:
FIGURE 3:
β1 integrin interacts with Arg in invadopodia. (A) Representative Western blot from the Arg bead pull-down assay. MDA-MB-231 cell lysates were incubated with BSA (negative control) or full-length Arg-coated beads, and the resulting pull-downs were run on SDS–PAGE and stained for β1 integrin. Two independent experiments. (B, C) β1 integrin–Arg acceptor photobleaching FRET. (B) Representative images of FRET efficiency between β1 integrin and Arg at Tks5-rich mature invadopodia in MDA-MB-231 cells at steady state (s.s.) or after integrin activation with 1 mM MnCl2 for 30 min (Mn2+). Dashed white circles denote mature invadopodia. Inset, magnified view of β1 integrin and Arg colocalized at invadopodia and the associated FRET efficiency. LUT bar indicates linear scale of FRET efficiency from 0 to 16%. Bar, 10 μm. (C) Quantification of β1 integrin–Arg and β1 integrin–cortactin FRET efficiencies at invadopodia. n > 61 invadopodia; n > 23 cells; three independent experiments. *p < 0.003. (D) Principle of PLA. Cells are fixed, permeabilized, and stained with primary antibodies (proteins of interest depicted as red and blue spheres). Secondary antibodies conjugated to complementary oligonucleotides are added. The oligonucleotides are hybridized and ligated, and the circular DNA is replicated by rolling circle amplification, incorporating fluorescently labeled nucleotides that can be detected by microscopy. Adapted from Olink. (E) Representative maximum-intensity Z‑projection images of MDA-MB-231 cells showing colocalization of β1 integrin-–Arg PLA events (green) with mature, Tks5-rich invadopodia (red; arrowheads) and negative control β1 integrin–IgG PLA events, which almost never colocalize with mature invadopodia. (F) Quantification of PLA signal colocalization with mature invadopodia. n > 131 invadopodia; n > 62 cells; three independent experiments. *p < 9.34E-5.
FIGURE 4:
FIGURE 4:
β1 integrin is required for Arg-mediated cortactin Y421 phosphorylation at invadopodium precursors in response to EGF stimulation. (A, B) Cortactin Y421 phosphorylation at precursors in the invadopodium precursor formation assay in MDA-MB-231 cells. (A) Representative images of control and β1 integrin siRNA (SMARTpool)–treated cells stimulated with EGF for 0 (untreated) or 3 min and stained with antibodies against cortactin, pY421 cortactin, and phalloidin (F-actin). Insets, Y421 phosphorylation status at cortactin-F-actin–rich invadopodium precursors. Bar, 10 μm. (B) Quantification of pY421 cortactin:total cortactin MFI at invadopodium precursors in cells treated with control or β1 integrin siRNA (left; n > 125 invadopodium precursors; n > 85 cells; three independent experiments) and control and Arg knockdown cells pretreated with IgG, K20, TS2/16, or mAb13 for 10 min before EGF stimulation (right; n > 80 invadopodia; n > 65 cells; three independent experiments). *p < 0.004; **p < 0.026 mAb13 compared with IgG, K20, and TS2/16 and Arg siRNA compared with control siRNA 3 min, IgG, K20, and TS2/16, respectively.
FIGURE 5:
FIGURE 5:
β1 integrin is required for cofilin-mediated barbed-end formation and actin polymerization at invadopodium precursors. (A, B) Cofilin–β-actin FRET at invadopodium precursors in MDA-MB-231 cells. (A) Representative images of cofilin–β-actin FRET efficiency at precursors in cells treated with control and β1 integrin siRNA (SMARTpool) and stimulated with EGF for 3 min. Dashed white circles denote invadopodium precursors. Insets, cofilin-actin–containing invadopodium precursors and the associated FRET efficiency. LUT bar indicates linear scale of FRET efficiency from 0 to 16%. Bar, 10 μm. (B) Quantification of cofilin–β-actin FRET efficiency at precursors 0 (untreated) or 3 min after EGF stimulation (control, 0 min, 4.34%; β1, 0 min, 3.85%). n > 60 invadopodium precursors; n > 35 cells; three independent experiments. *p < 0.018. (C, D) Barbed-end assay. (C) Representative images of cells treated with control or β1 integrin siRNA (SMARTpool), stimulated with EGF for 0 (untreated) or 3 min, and stained for anti-biotin (barbed ends), cortactin, and Arp2. Inset, barbed-end intensity at cortactin-Arp2–containing invadopodium precursors. Bar, 10 μm. (D) Quantification of barbed-end MFI at invadopodium precursors. n > 190 invadopodium precursors; n > 126 cells; three independent experiments. *p < 1.22E‑11. (E) Western blot analysis of MDA-MB-231 cells transfected with control or cofilin siRNA for 48 h. Blots were stained for cofilin and β-actin (loading control).
FIGURE 6:
FIGURE 6:
β1 integrin promotes invadopodial matrix degradation in 3D extracellular matrix. (A–D) 3D extracellular matrix invadopodium assay. (A) Representative maximum-intensity Z‑projection multiphoton images of MDA-MB-231 cells transiently transfected with control or β1 integrin siRNA and TagRFP-cortactin. Cells were embedded in a 3D ECM gel consisting of type I collagen, DQ-type I collagen, and Matrigel for 36 h. (B) Quantification of invadopodium number in control, β1 integrin–depleted, and mab13-treated cells in 3D matrix. n > 115 cells; three independent experiments. *p < 1.27E-15, compared with control siRNA. (C) Quantification of invadopodium length in 3D matrix. n > 115 cells; three independent experiments. *p < 0.013, compared with control siRNA. (D) Quantification of mean DQ-collagen (degradation) MFI per protrusion > 7 μm. n > 115 cells; three independent experiments. *p < 3.15E-9, compared with control siRNA.
FIGURE 7:
FIGURE 7:
Model of β1 integrin–dependent regulation of invadopodia. β1 integrin is activated in invadopodium precursors, leading to increased local β1 integrin adhesion in the protrusion/core, which is a key switch that drives Arg activation, cortactin phosphorylation, and MMP recruitment during invadopodial maturation. It is proposed that β1 integrin-EGFR cross-talk activates Arg by a three-step mechanism: 1) Arg binding to the β1 integrin cytoplasmic tail is believed to disrupt its autoinhibitory conformation, unmasking the Y272 autophosphorylation site and Y439 on the activation loop. 2) Integrin-mediated clustering of Arg likely facilitates autophosphorylation on Y272. 3) EGFR activation induces Src-dependent Arg phosphorylation on Y439, resulting in full Arg kinase activation. Arg-dependent cortactin phosphorylation results in the recruitment of NHE-1 to increase the local intracellular pH, resulting in disruption of the inhibitory interaction between cortactin and cofilin and recruitment of Nck1 for N‑WASp activation to induce Arp2/3-dependent actin polymerization. In this way, β1 integrin acts as a critical upstream regulator of Arg kinase activity, actin polymerization, and subsequent protease recruitment to promote efficient invadopodial matrix degradation.

Similar articles

Cited by

References

    1. Artym VV, Zhang Y, Seillier-Moiseiwitsch F, Yamada KM, Mueller SC. Dynamic interactions of cortactin and membrane type 1 matrix metalloproteinase at invadopodia: defining the stages of invadopodia formation and function. Cancer Res. 2006;66:3034–3043. - PubMed
    1. Askari JA, Tynan CJ, Webb SED, Martin-Fernandez ML, Ballestrem C, Humphries MJ. Focal adhesions are sites of integrin extension. J Cell Biol. 2010;188:891–903. - PMC - PubMed
    1. Bazzoni G, Shih DT, Buck CA, Hemler ME. Monoclonal-antibody 9EG7 defines a novel beta(1) integrin epitope induced by soluble ligand and manganese, but inhibited by calcium. J Biol Chem. 1995;270:25570–25577. - PubMed
    1. Bharadwaj S, Thanawala R, Bon G, Falcioni R, Prasad GL. Resensitization of breast cancer cells to anoikis by tropomyosin-1: role of Rho kinase-dependent cytoskeleton and adhesion. Oncogene. 2005;24:8291–8303. - PubMed
    1. Bradley WD, Hernandez SE, Settleman J, Koleske AJ. Integrin signaling through Arg activates p190RhoGAP by promoting its binding to p120RasGAP and recruitment to the membrane. Mol Biol Cell. 2006;17:4827–4836. - PMC - PubMed

Publication types

MeSH terms