. 2013 Jun;24(11):1676-87, S1-7.
doi: 10.1091/mbc.E12-10-0772. Epub 2013 Apr 3.

The Drosophila F-box protein dSkp2 regulates cell proliferation by targeting Dacapo for degradation

Affiliations

The Drosophila F-box protein dSkp2 regulates cell proliferation by targeting Dacapo for degradation

Wen Dui et al. Mol Biol Cell. 2013 Jun.

Abstract

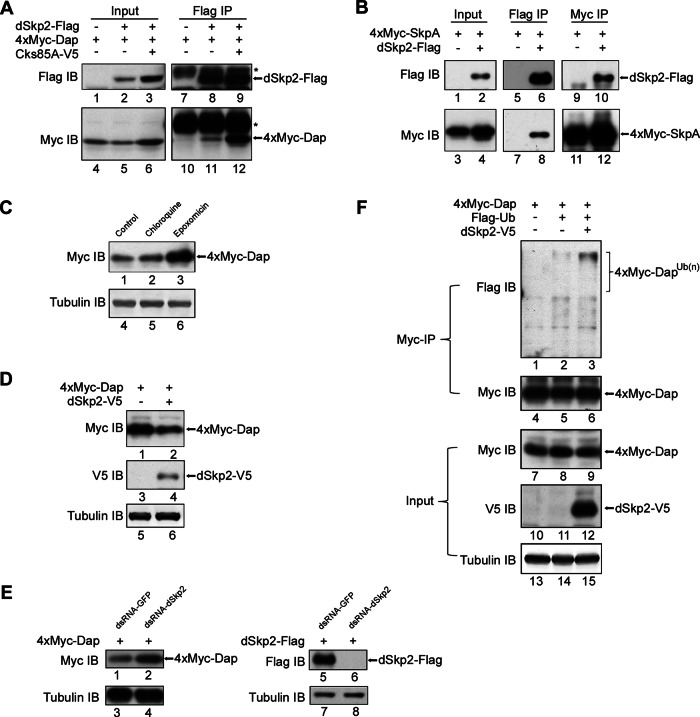
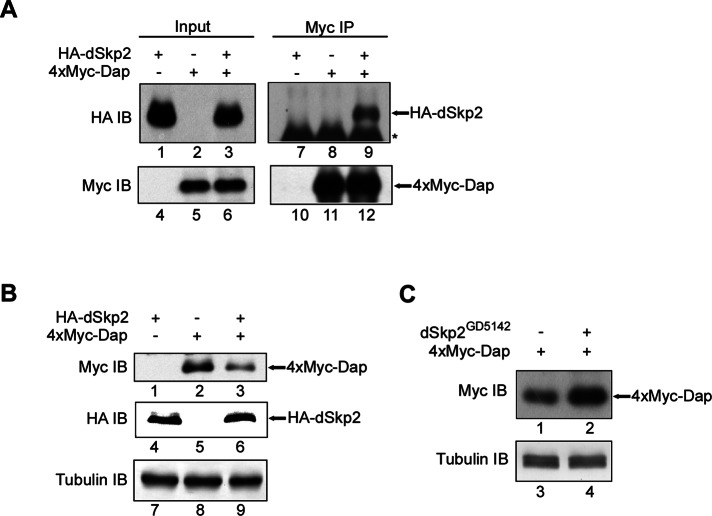
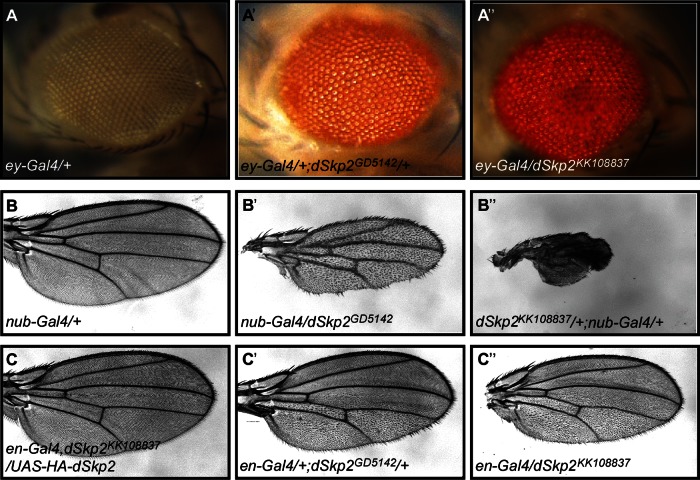
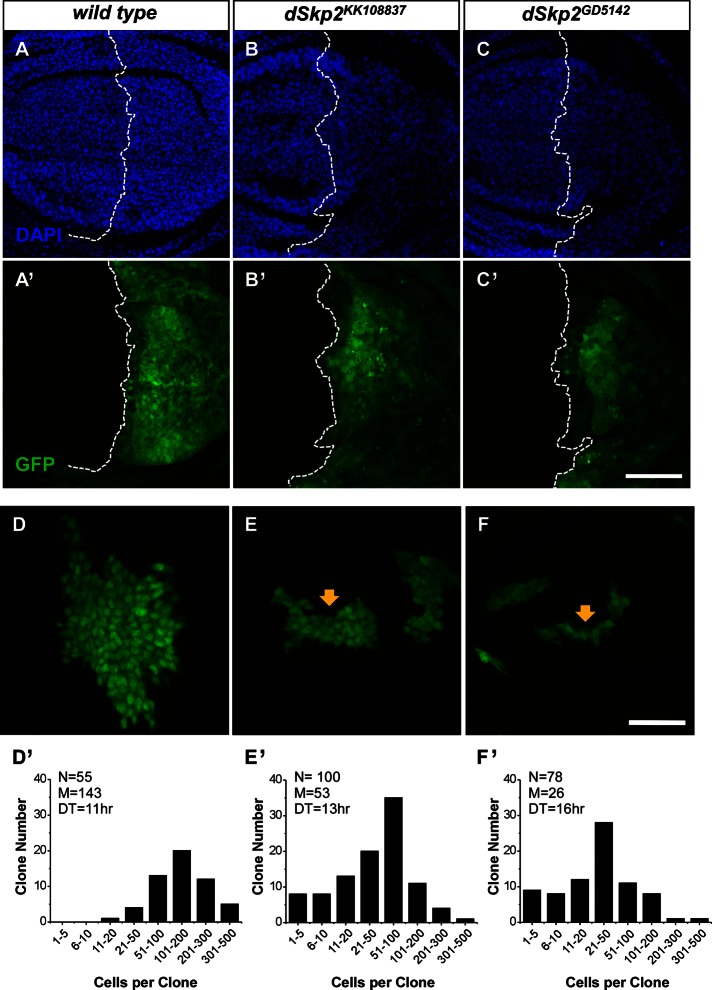
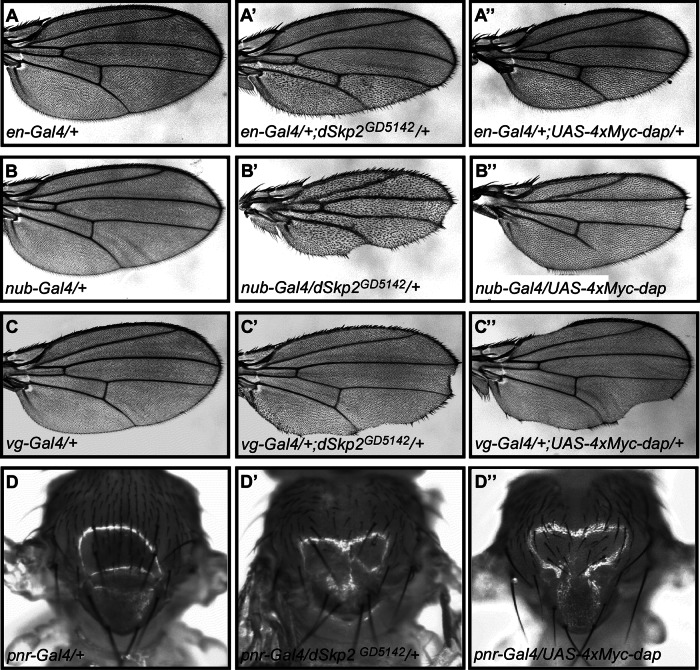
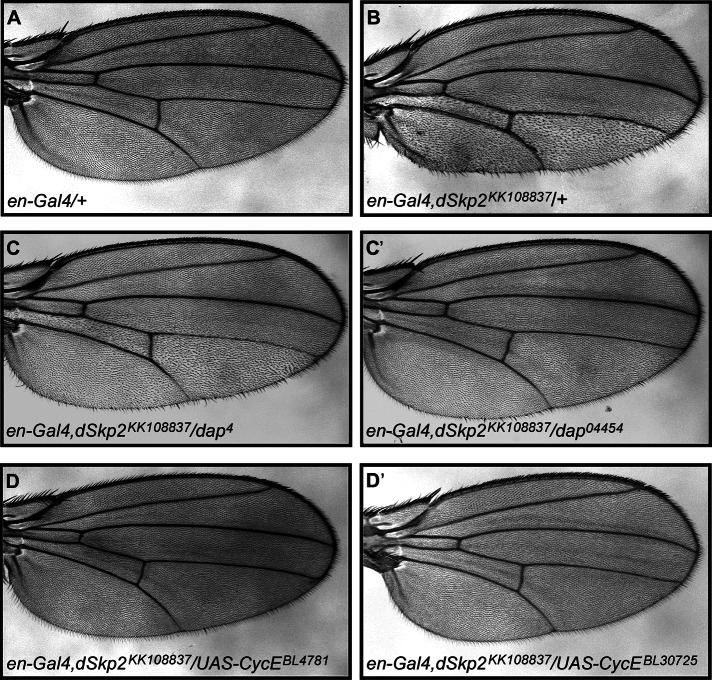
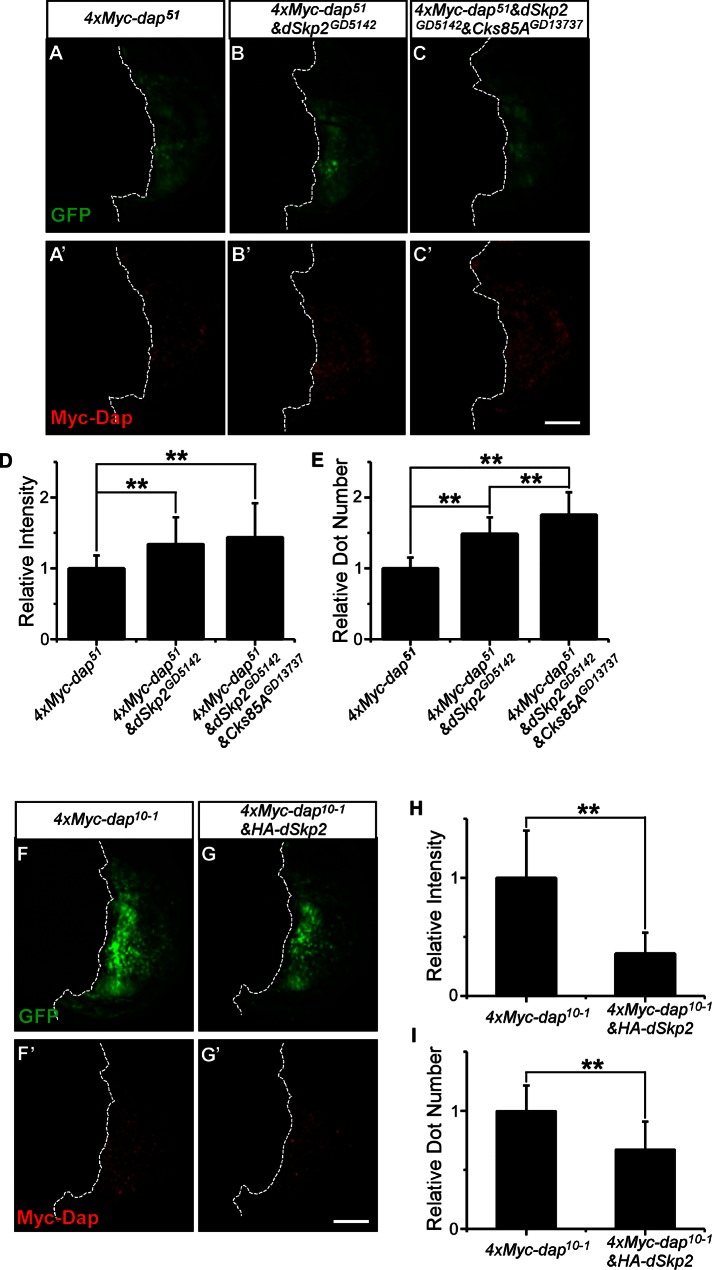
Cell cycle progression is controlled by a complex regulatory network consisting of interacting positive and negative factors. In humans, the positive regulator Skp2, an F-box protein, has been a subject of intense investigation in part because of its oncogenic activity. By contrast, the molecular and developmental functions of its Drosophila homologue, dSkp2, are poorly understood. Here we investigate the role of dSkp2 by focusing on its functional relationship with Dacapo (Dap), the Drosophila homologue of the cyclin-dependent kinase inhibitors p21(cip1)/p27(kip1)/p57(kip2). We show that dSkp2 interacts physically with Dap and has a role in targeting Dap for ubiquitination and proteasome-mediated degradation. We present evidence that dSkp2 regulates cell cycle progression by antagonizing Dap in vivo. dSkp2 knockdown reduces cell density in the wing by prolonging the cell doubling time. In addition, the wing phenotype caused by dSkp2 knockdown resembles that caused by dap overexpression and can be partially suppressed by reducing the gene dose of dap. Our study thus documents a conserved functional relationship between dSkp2 and Dap in their control of cell cycle progression, suggesting the possibility of using Drosophila as a model system to study Skp2-mediated tumorigenesis.


Figures

FIGURE 1:
FIGURE 1:
dSkp2 interacts with Dap and regulates Dap stability in S2 cells. (A) CoIP between dSkp2 and Dap. S2 cells were transfected with the indicated combination of plasmids. The anti-Flag antibody was used for IP. Antibodies used for immunoblotting (IB) are indicated on the left. Cks85A is the Drosophila homologue of Cks1; its expression in S2 cells increased the amount of coIP products (lane 12; see Discussion). Asterisk, heavy chain of immunoglobulin G. (B) CoIP between dSkp2 and SkpA. S2 cells were transfected with the indicated combination of plasmids. Anti-Flag antibody (lanes 5–8) or anti-Myc antibody (lanes 9–12) were used for IP, followed by IB using anti-Flag and anti-Myc antibodies to detect dSkp2-Flag and 4xMyc-SkpA, respectively. (C) Dap protein level in S2 cells is sensitive to proteasome inhibitor. S2 cells were transfected with the 4xMyc-dap plasmid and then treated with the indicated inhibitors (chloroquine and epoxomicin; see the text) for 5 h before cell harvest. Total amount of 4xMyc-Dap in cells was detected by IB using the anti-Myc antibody (lanes 1–3). Tubulin (lanes 4–6) was blotted as loading control. (D) Dap protein level in S2 cells is sensitive to dSkp2 overexpression. S2 cells were cotransfected with the indicated plasmids and cycloheximide (CHX) was added to block translation 5 h before cell harvest. Total protein was detected in IB using the indicated antibodies. Tubulin (lanes 5 and 6) is loading control. (E) S2 cells were first treated with control (GFP) dsRNA (lanes 1, 3, 5, and 7) or dSkp2 dsRNA (lanes 2, 4, 6, and 8) for two times, each lasting 3 d. Cells were then transfected with plasmids expressing 4xMyc-Dap before harvesting (48 h later) for the detection of the total amount of 4xMyc-Dap (lanes 1 and 2). RNAi efficiency was estimated by the reduction in the amount of dSkp2-Flag upon RNAi treatment (lanes 5 and 6). Tubulin (lanes 3, 4, 7, and 8) represents loading control. (F) dSkp2 overexpression enhances the ubiquitination status of Dap. S2 cells were transiently transfected with the indicated plasmids. Whole-cell extracts were prepared for coIP by the anti-Myc antibody. Anti-Flag antibody was used to detect the ubiquitinated species of 4xMyc-Dap as marked. Input represents 1% of the extracts used in coIP.
FIGURE 2:
FIGURE 2:
dSkp2 interacts with Dap and regulates Dap protein level in Drosophila tissues. (A) CoIP analysis detecting dSkp2-Dap interaction. Extracts were prepared from the adult heads of flies with the indicated genotypes: GMR>HA-dSkp2 (lanes 1, 4, 7, and 10), GMR>4xMyc-dap (lanes 2, 5, 8, and 11), and GMR>HA-dSkp2 + GMR>4xMyc-dap (lanes 3, 6, 9, and 12). The immunoprecipitates were pulled down with the anti-Myc antibody, and the anti-HA antibody was used in IB to detect the presence of HA-dSkp2. (B) dSkp2 regulates Dap stability. Extracts were prepared from the adult heads of flies as in A. Total protein level in the extracts was detected in IB using the indicated antibodies. Tubulin (lanes 7–9) is loading control. (C) dSkp2 knockdown in Drosophila eyes leads to accumulated Dap proteins in tissue extracts. Extracts were prepared from the adult heads of flies with the indicated genotypes: GMR>4xMyc-dap (lanes 1 and 3) and GMR>4xMyc-dap + GMR>dSkp2GD5142 (lanes 2 and 4). Myc-tagged Dap protein level was determined by Western blotting using the Myc antibody. Tubulin (lanes 3 and 4) represents loading control.
FIGURE 3:
FIGURE 3:
Tissue-specific knockdown of dSkp2 causes developmental defects. (A, A′, and A′′) Rough eyes induced by dSkp2 knockdown in the eye (with the use of the ey-Gal4 driver). Results from two independent RNAi lines are shown. (B′, B′′) nub-Gal4-driven expression of these two dSkp2 RNAi lines in the entire wing results in a similar wing hair spacing phenotype (WHS; see the text for details). Control is shown in B. (C′, C′′) dSkp2 knockdown in the posterior region of the wing (driven by en-Gal4) leads to the WHS phenotype in the posterior region only. This phenotype is fully rescued by a simultaneous overexpression of HA-dSkp2 (C).
FIGURE 4:
FIGURE 4:
Knockdown of dSkp2 slows cell proliferation in the wing discs. (A–C) DAPI staining of wing imaginal discs showing nuclear density differences in the posterior region of the disc with (B, C) or without (A) dSkp2 knockdown (driven by en-Gal4 in combination with UAS-dcr2 at 29°C). GFP signals mark the expression domain of en-Gal4 (B′, C′). (A′) The en-Gal4, UAS-GFP control. The genotypes are UAS-dcr2/+; en-Gal4, UAS-GFP/+ (A, A′), UAS-dcr2/+; en-Gal4, UAS-GFP/dSkp2KK108837 (B, B′), and UAS-dcr2/+; en-Gal4, UAS-GFP/+; dSkp2GD5142/+ (C, C′). Scale bar, 50 μm. (D–F) Cell division rate is decreased by dSkp2 knockdown (E, F), and GFP signals mark the RNAi-expressing clones (see the text for details), leading to smaller clones (arrows in E and F). In D, the GFP-marked cells are wild type. (D′–F′) Bar graphs showing the distribution of clones with different cell number per clone. N, number of total clones counted; M, median cell number per clone; DT, doubling time. The genotypes are y w, hs-flp/+; Act>y+>Gal4, UAS-GFP/+ (D and D’), y w, hs-flp/+; Act>y+>Gal4, UAS-GFP/dSkp2KK108837 (E, E′), and y w, hs-flp/+;Act>y+>Gal4, UAS-GFP/+; dSkp2GD5142/+ (F, F′). Scale bar, 25 μm.
FIGURE 5:
FIGURE 5:
Similar phenotypes caused by dap overexpression and dSkp2 knockdown. Light microscopic images showing wings (A, A′, and A′′; B, B′, and B′′; C, C′, and C′′) and nota (D, D′, and D′′) from flies with the indicated genotypes. (A) A control wing of en-Gal4. (A′, A′′) Wings exhibiting the WHS phenotype (with different severity) in the posterior regions, caused by either dSkp2 knockdown (A′) or dap overexpression (A′′), each under the control of en-Gal4. (B) A control wing of nub-Gal4. (B′, B′′) Wings showing the WHS phenotype in the entire wing by either dSkp2 knockdown (B′) or dap overexpression (B′′) under the control of nub-Gal4. (C) A control wing of vg-Gal4. (C′, C′′) Wings showing nicking phenotype on the wing margin (arrows), caused by either dSkp2 knockdown (C′) or dap overexpression (C′′) under the control of vg-Gal4. (D) A control notum of pnr-Gal4. (D′, D′′) Nota displaying dorsal closure defects and loss of bristles by either dSkp2 knockdown (D′) or overexpression of dap (D′′) under the control of pnr-Gal4.
FIGURE 6:
FIGURE 6:
dSkp2 genetically interacts with dap and CycE in the Drosophila wing. (A) A control wing of en-Gal4. (B) dSkp2 knockdown in the posterior region of the wing under the control of en-Gal4 leads to the typical WHS phenotype. Introducing a mutant copy of either dap04454 (C) or dap4 (C′) into the en>dSkp2KK108837 flies partially suppresses the WHS phenotype. Overexpression of CycE from UAS-CycE (D, D′, two independent transgenes) almost completely rescues the WHS phenotype caused by en>dSkp2KK108837.
FIGURE 7:
FIGURE 7:
dSkp2 has a role in regulating Dap protein level in vivo. (A–E) Knockdown of dSkp2 leads to an increase in fluorescence signals for 4xMyc-Dap in wing discs. 4xMyc-dap51 was expressed in the posterior regions of the wing discs under the control of en-Gal4 either alone (A, A′) or with the dSkp2 knockdown (B, B′) or with a simultaneous knockdown of dSkp2 and Cks85A (C, C′). The confocal images shown were from side-by-side experiments and were captured under identical imaging settings. (D, E) Mean number of clusters of fluorescence signals (referred to as dots) per disc and mean aggregate intensity (in arbitrary units), respectively, of the detected dots. Error bars, SD calculated across different discs in a group. n = 20 discs for each genotype. (F–I) Coexpression of HA-dSkp2 leads to a reduction in fluorescence signals for 4xMyc-Dap in wing discs. 4xMyc-dap10–1 was expressed in the posterior region of the wing discs under the control of en-Gal4 either alone (F, F′) or with HA-dSkp2 together (G, G′). The confocal images shown were based on side-by-side experiments with images captured under identical settings. (H,I) Mean number of fluorescent dots detected per disc and mean aggregate intensity (in arbitrary units) of the detected dots, respectively. n = 13 for 4xMyc-dap10–1 discs and 19 for 4xMyc-dap10–1&HA-dSkp2 discs. **p < 0.01 (Student's t test). Scale bar, 75 μm.

Similar articles

Cited by

References

    1. Adams PD, Sellers WR, Sharma SK, Wu AD, Nalin CM, Kaelin WG Jr. Identification of a cyclin-cdk2 recognition motif present in substrates and p21-like cyclin-dependent kinase inhibitors. Mol Cell Biol. 1996;16:6623–6633. - PMC - PubMed
    1. Amati B, Vlach J. Kip1 meets SKP2: new links in cell-cycle control. Nat Cell Biol. 1999;1:E91–E93. - PubMed
    1. Ben-Izhak O, Lahav-Baratz S, Meretyk S, Ben-Eliezer S, Sabo E, Dirnfeld M, Cohen S, Ciechanover A. Inverse relationship between Skp2 ubiquitin ligase and the cyclin dependent kinase inhibitor p27Kip1 in prostate cancer. J Urol. 2003;170:241–245. - PubMed
    1. Bhattacharya S, Garriga J, Calbo J, Yong T, Haines DS, Grana X. SKP2 associates with p130 and accelerates p130 ubiquitylation and degradation in human cells. Oncogene. 2003;22:2443–2451. - PubMed
    1. Bond M, Sala-Newby GB, Wu YJ, Newby AC. Biphasic effect of p21Cip1 on smooth muscle cell proliferation: role of PI 3-kinase and Skp2-mediated degradation. Cardiovasc Res. 2006;69:198–206. - PubMed

Publication types

MeSH terms

Substances

LinkOut - more resources