

Movement of NH₃ through the human urea transporter B: a new gas channel
- PMID: 23552862
- PMCID: PMC3680674
- DOI: 10.1152/ajprenal.00609.2012
Movement of NH₃ through the human urea transporter B: a new gas channel
Abstract
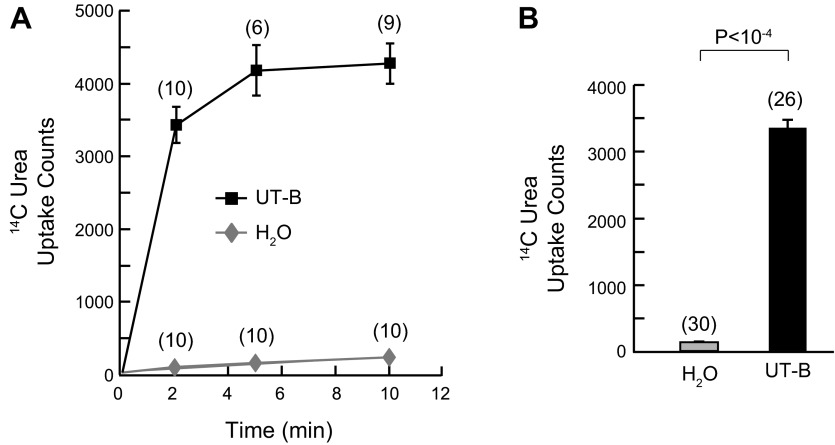
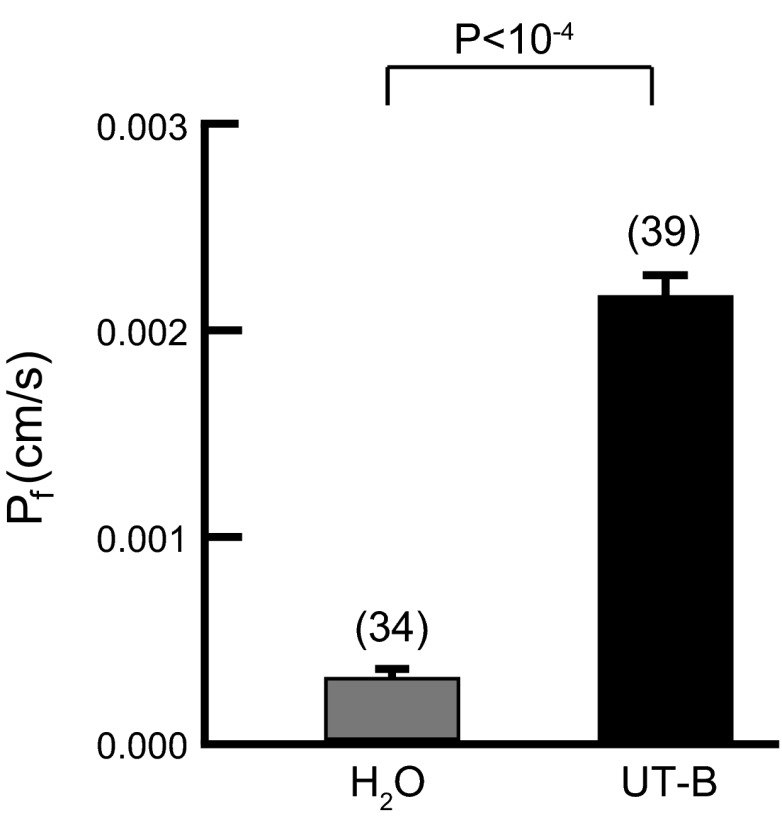
Aquaporins and Rh proteins can function as gas (CO₂ and NH₃) channels. The present study explores the urea, H₂O, CO₂, and NH₃ permeability of the human urea transporter B (UT-B) (SLC14A1), expressed in Xenopus oocytes. We monitored urea uptake using [¹⁴C]urea and measured osmotic water permeability (Pf) using video microscopy. To obtain a semiquantitative measure of gas permeability, we used microelectrodes to record the maximum transient change in surface pH (ΔpHS) caused by exposing oocytes to 5% CO₂/33 mM HCO₃⁻ (pHS increase) or 0.5 mM NH₃/NH₄⁺ (pHS decrease). UT-B expression increased oocyte permeability to urea by >20-fold, and Pf by 8-fold vs. H₂O-injected control oocytes. UT-B expression had no effect on the CO₂-induced ΔpHS but doubled the NH₃-induced ΔpHS. Phloretin reduced UT-B-dependent urea uptake (Jurea*) by 45%, Pf* by 50%, and (- ΔpHS*)NH₃ by 70%. p-Chloromercuribenzene sulfonate reduced Jurea* by 25%, Pf* by 30%, and (ΔpHS*)NH₃ by 100%. Molecular dynamics (MD) simulations of membrane-embedded models of UT-B identified the monomeric UT-B pores as the main conduction pathway for both H₂O and NH₃ and characterized the energetics associated with permeation of these species through the channel. Mutating each of two conserved threonines lining the monomeric urea pores reduced H₂O and NH₃ permeability. Our data confirm that UT-B has significant H₂O permeability and for the first time demonstrate significant NH₃ permeability. Thus the UTs become the third family of gas channels. Inhibitor and mutagenesis studies and results of MD simulations suggest that NH₃ and H₂O pass through the three monomeric urea channels in UT-B.
Keywords: ammonia transport; carbon dioxide transport; membrane protein; urea transport; water transport.
Figures


Similar articles
-
Ammonia transport mediated by urea transporter A isoforms.Biol Open. 2025 Jun 15;14(6):bio061655. doi: 10.1242/bio.061655. Epub 2025 Jun 6. Biol Open. 2025. PMID: 40478683 Free PMC article.
-
Water transport mediated by murine urea transporters: implications for urine concentration mechanisms.Biol Open. 2020 Aug 14;9(8):bio051805. doi: 10.1242/bio.051805. Biol Open. 2020. PMID: 32661130 Free PMC article.
-
Relative CO₂/NH₃ permeabilities of human RhAG, RhBG and RhCG.J Membr Biol. 2013 Dec;246(12):915-26. doi: 10.1007/s00232-013-9593-0. J Membr Biol. 2013. PMID: 24077989 Free PMC article.
-
Ammonia and urea permeability of mammalian aquaporins.Handb Exp Pharmacol. 2009;(190):327-58. doi: 10.1007/978-3-540-79885-9_17. Handb Exp Pharmacol. 2009. PMID: 19096786 Review.
-
Transport characteristics of urea transporter-B.Subcell Biochem. 2014;73:127-35. doi: 10.1007/978-94-017-9343-8_8. Subcell Biochem. 2014. PMID: 25298342 Review.
Cited by
-
Lithobates catesbeianus (American Bullfrog) oocytes: a novel heterologous expression system for aquaporins.Biol Open. 2018 Mar 29;7(4):bio031880. doi: 10.1242/bio.031880. Biol Open. 2018. PMID: 29530931 Free PMC article.
-
Evidence from simultaneous intracellular- and surface-pH transients that carbonic anhydrase II enhances CO2 fluxes across Xenopus oocyte plasma membranes.Am J Physiol Cell Physiol. 2014 Nov 1;307(9):C791-813. doi: 10.1152/ajpcell.00051.2014. Epub 2014 Jun 25. Am J Physiol Cell Physiol. 2014. PMID: 24965587 Free PMC article.
-
Role of channels in the O2 permeability of murine red blood cells II. Morphological and proteomic studies.bioRxiv [Preprint]. 2025 May 18:2025.03.05.639962. doi: 10.1101/2025.03.05.639962. bioRxiv. 2025. PMID: 40462928 Free PMC article. Preprint.
-
Computing membrane-AQP5-phosphatidylserine binding affinities with hybrid steered molecular dynamics approach.Mol Membr Biol. 2015;32(1):19-25. doi: 10.3109/09687688.2015.1006275. Epub 2015 May 8. Mol Membr Biol. 2015. PMID: 25955791 Free PMC article.
-
Energetic and molecular water permeation mechanisms of the human red blood cell urea transporter B.PLoS One. 2013 Dec 20;8(12):e82338. doi: 10.1371/journal.pone.0082338. eCollection 2013. PLoS One. 2013. PMID: 24376529 Free PMC article.
References
-
- Berger UV, Tsukaguchi H, Hediger MA. Distribution of mRNA for the facilitated urea transporter UT3 in the rat nervous system. Anat Embryol 197: 405–414, 1998 - PubMed
-
- Chandy G, Zampighi GA, Kreman M, Hall JE. Comparison of the water transporting properties of MIP and AQP1. J Membr Biol 159: 29–39, 1997 - PubMed
-
- Cooper GJ, Boron WF. The CO2 permeability of the AQP1 water channel, expressed in Xenopus oocytes. J Am Soc Nephrol 8: 16A, 1997
-
- Cooper GJ, Boron WF. Effect of PCMBS on CO2 permeability of Xenopus oocytes expressing aquaporin 1 or its C189S mutant. Am J Physiol Cell Physiol 275: C1481–C1486, 1998 - PubMed
Publication types
MeSH terms
Substances
Grants and funding
LinkOut - more resources
Full Text Sources
Other Literature Sources