. 2013 Mar 25;2(3):e40.
doi: 10.1038/oncsis.2013.3.

Downregulation of miRNA-31 induces taxane resistance in ovarian cancer cells through increase of receptor tyrosine kinase MET

Affiliations

Downregulation of miRNA-31 induces taxane resistance in ovarian cancer cells through increase of receptor tyrosine kinase MET

T Mitamura et al. Oncogenesis. .

Abstract

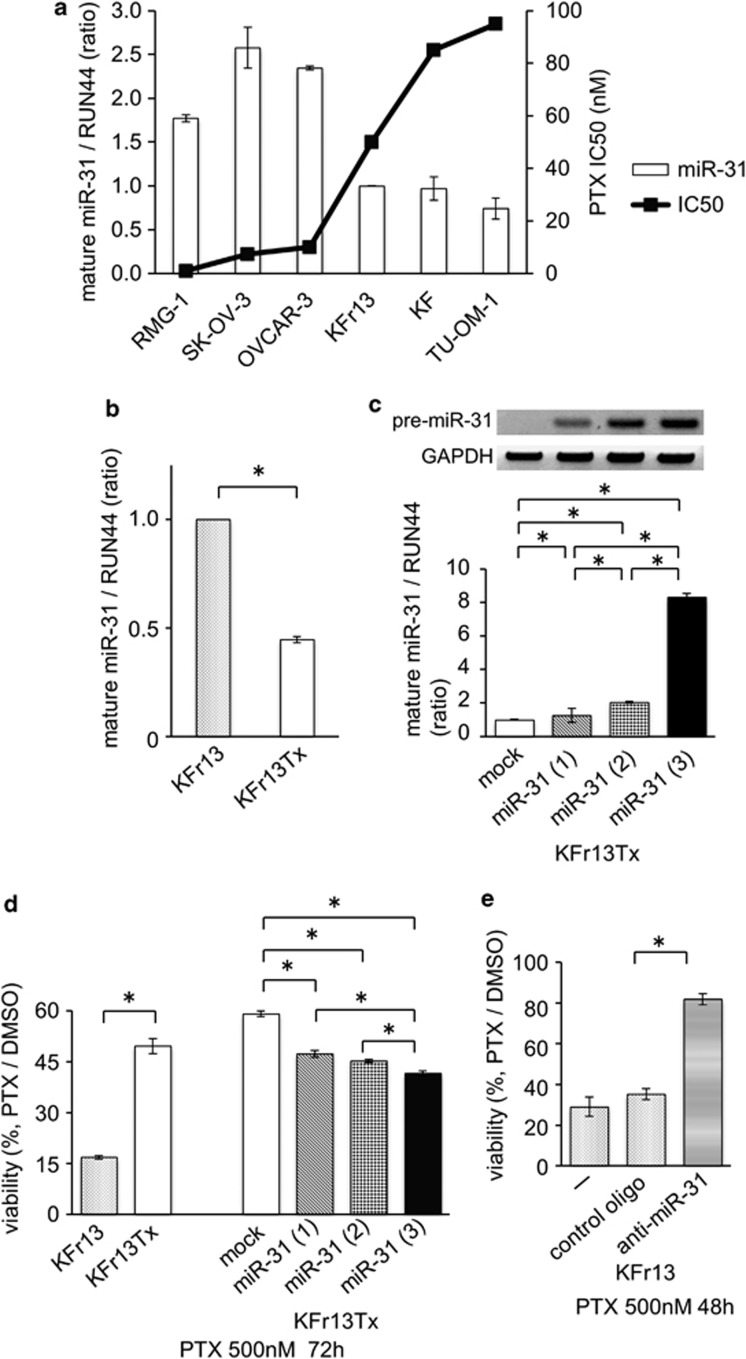
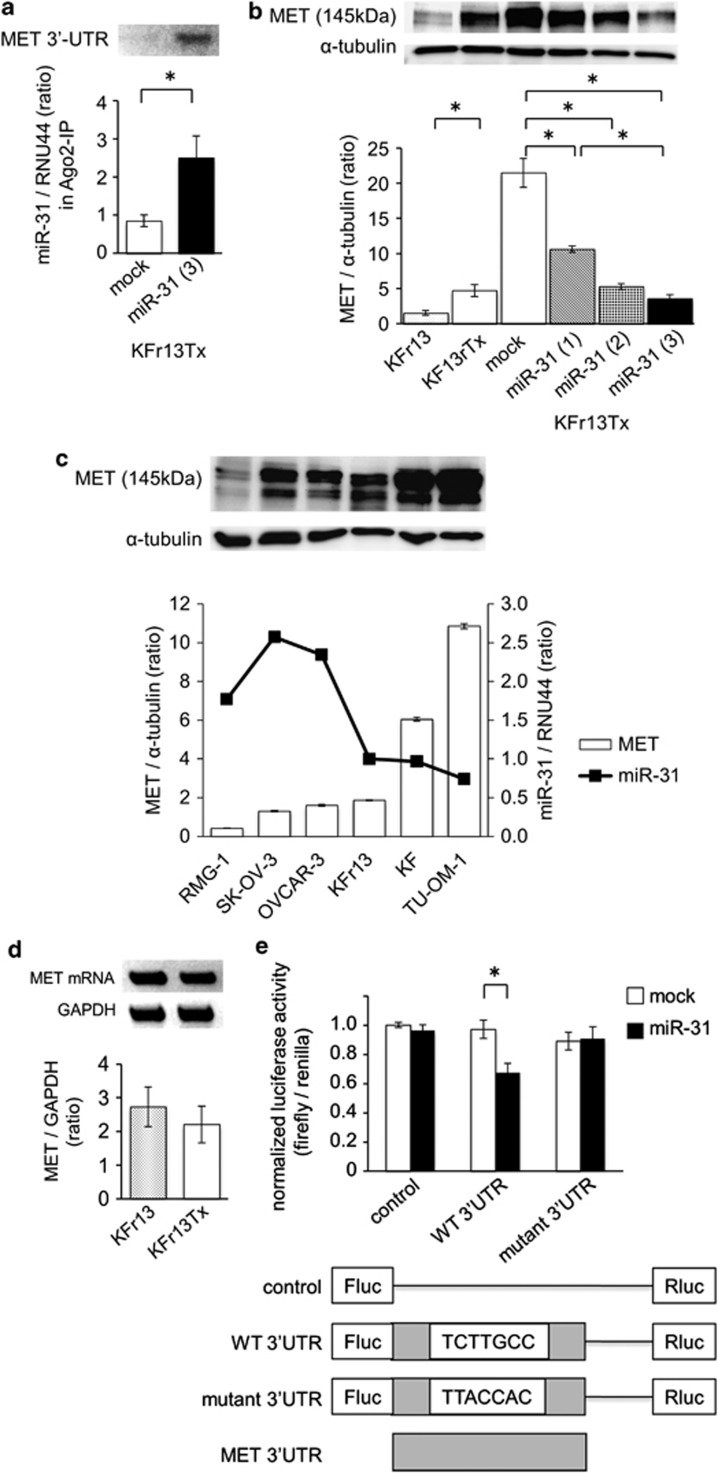
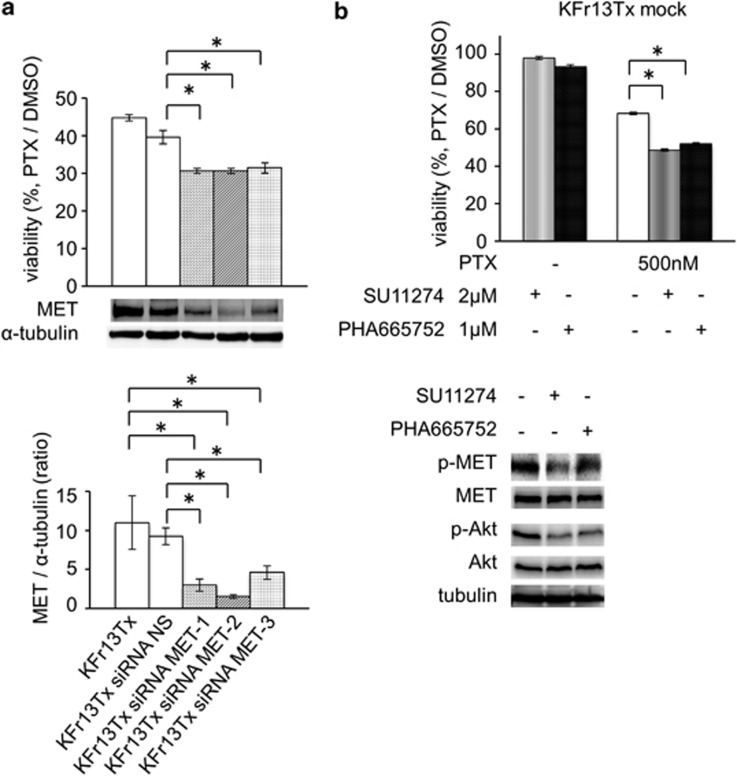
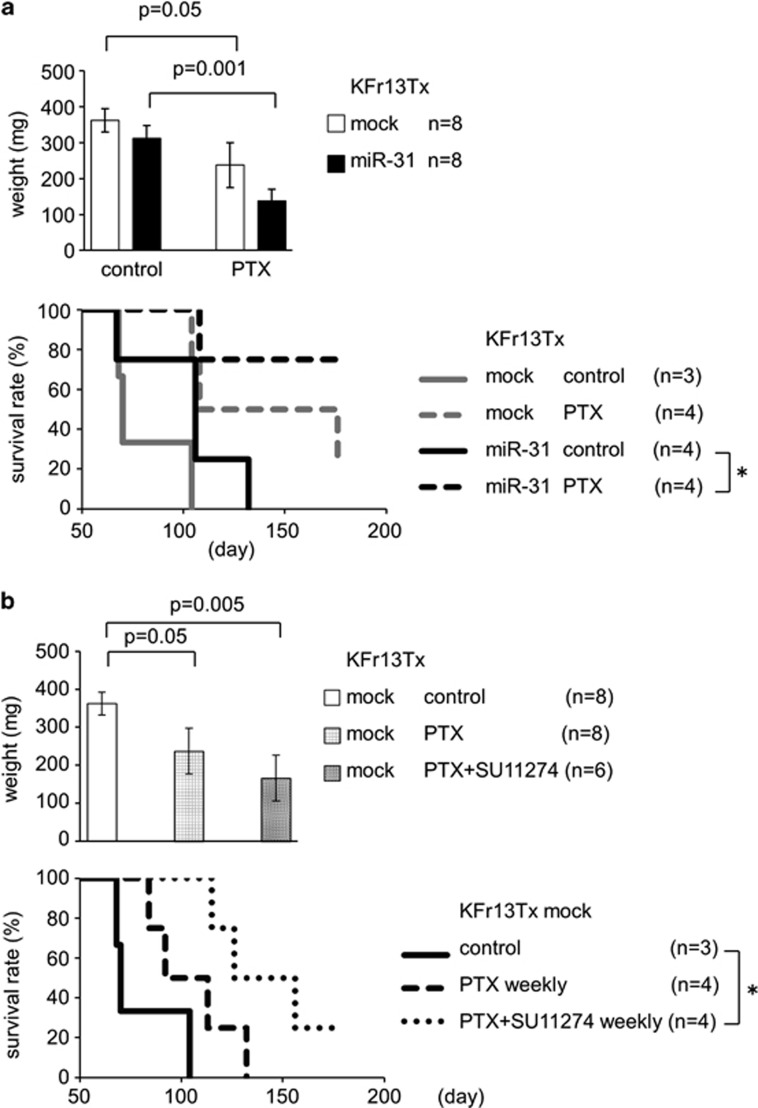
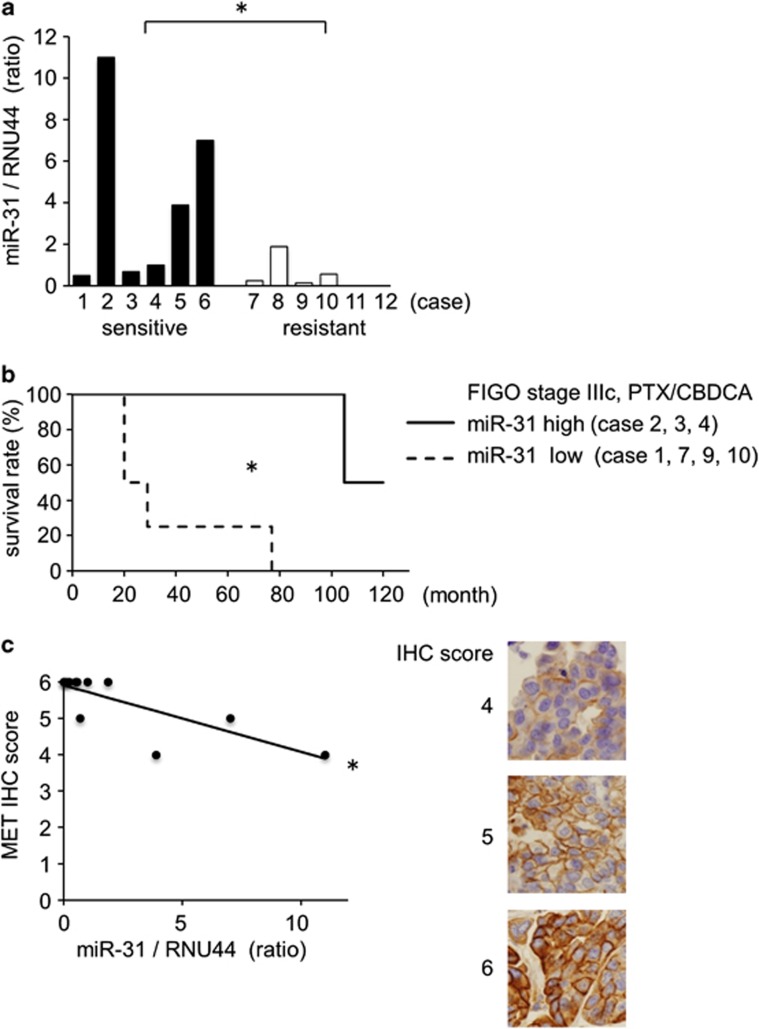
Ovarian cancer is one of the most aggressive female reproductive tract tumors. Paclitaxel (PTX) is widely used for the treatment of ovarian cancer. However, ovarian cancers often acquire chemotherapeutic resistance to this agent. We investigated the mechanism of chemoresistance by analysis of microRNAs using the ovarian cancer cell line KFr13 and its PTX-resistant derivative (KFr13Tx). We found that miR-31 was downregulated in KFr13Tx cells, and that re-introduction of miR31 re-sensitized them to PTX both in vitro and in vivo. miR-31 was found to bind to the 3'-UTR of mRNA of MET, and the decrease in MET correlated to higher sensitivity to PTX. Furthermore, co-treatment of KFr13Tx cells with MET inhibitors sensitized the tumor cells to PTX both in vitro and in vivo. In addition, lower levels of miR31 and higher expression of MET in human ovarian cancer specimens were significantly correlated with PTX chemoresistance and poor prognosis. This study demonstrated miR31-dependent regulation of MET for chemoresistance of ovarian cancer, raising the possibility that combination therapy with a MET inhibitor and PTX will increase PTX efficacy.


Figures

Figure 1
Figure 1
Overexpression of miR-31 re-sensitized PTX-resistant ovarian cancer cell to PTX in vitro. (a) Real-time PCR analysis of expression levels of miR-31 and IC50 of PTX in six human ovarian cancer cell lines. (b) Real-time PCR analysis of expression levels of miR-31 in parental (KFr13) and PTX-resistant (KFr13Tx) cells. *P<0.05. (c) Establishment of three cell lines of KFr13Tx expressing miR-31. Expression levels of miR-31 in cells named as miR-31 (1), miR-31 (2) and miR-31 (3) are low, middle and high, respectively. Representative RT–PCR bands are shown as top panel. Real-time PCR analysis of expression levels of miR-31 in miR-31 (1), miR31 (2) and miR (3) are shown in bottom bar graph. Original gel is presented in Supplementary Figure S3a, *P<0.05. (d) Chemosensitivity to PTX is shown by MTT assay, *P<0.05. (e) Effect of anti-miR-31 on chemosensitivity to PTX analyzed by MTT assay, *P<0.05.
Figure 2
Figure 2
miR-31 regulates MET expression by translation inhibition. (a) Detection of MET mRNA by RT–PCR (top panel) and miR-31 by real-time PCR in Ago2-mediated immunoprecipitated RNA fraction in KFr13Tx. Original gel is presented in Supplementary Figure S3b, *P<0.05. (b) Expression levels of MET in wild-type and miR31-overexpressing cells. Results of immunoblotting of MET and α-tubulin are shown as top panel and the ratio of MET/α-tubulin are shown as bar graph. Original blots are presented in Supplementary Figure S3c, *P<0.05. (c) Expression levels of MET and miR-31 in six human ovarian cancer cell lines. Results of immunoblotting of MET and α-tubulin are shown as top panel. The ratio of MET/α-tubulin and miR-31 expression is shown in bottom bar and line graph, respectively. (d) mRNA levels of MET in KFr13 and KFr13Tx analyzed by RT–PCR are shown as top panel. Ratio of MET/GAPDH is shown as bar graph. Original gel is presented in Supplementary Figure S3d. (e) Luciferase activity after transfection of the indicated 3′-UTR-driven reporter constructs. Reporter plasmid containing 3′-UTR region of MET as WT3′-UTR and its mutant as mutant 3′-UTR, *P<0.05.
Figure 3
Figure 3
MET regulates PTX sensitivity in ovarian cancer cell in vitro. (a) Chemosensitivity to PTX of KFr13Tx analyzed by MTT assay are shown as bar graph (top). Immunoblotting of MET and α-tubulin when siRNAs were transfected (middle panel). The ratio of MET/α-tubulin is shown as bar graph (lower). Original blots are presented in Supplementary Figure S3e, *P<0.05. (b) Effect of MET inhibitor, SU11274 and PHA665752 on chemosensitivity to PTX analyzed by MTT assay. Effect of MET inhibitor was validated by immunoblotting for phosphorylated form of MET (pMET) and Akt (pAkt). Original blots are presented in Supplementary Figure S3f, *P<0.05.
Figure 4
Figure 4
(a, top graph) Overexpression of miR-31 re-sensitized PTX-resistant ovarian cancer cell to PTX in vivo. Average of the weight of tumor in flank of mice. Solid bar indicates miR-31-expressing KFr13Tx cells. Open bar indicates KFr13Tx cells. Unpaired one-tailed t-test. (a, bottom graph) Survival of mice with intraperitoneal injection of KFr13Tx or KFr13Tx expressing miR-31 treated with PTX. KFr13Tx with PTX (gray broken line), KFr13Tx without PTX (gray solid line), KFr13Tx expressing miR-13 with PTX (black broken line), KFr13Tx expressing miR-13 without PTX (black solid line). *P<0.05, log-rank test. (b, top graph) Effect of combination treatment of MET inhibitor and PTX on KFr13Tx cells in vivo. Average of the weight of tumor in flank of mice. Open bar indicates no treatment, closed bar as PTX alone, hatched bar as combination of both PTX and MET inhibitor SU11274. *P<0.05, unpaired one-tailed t-test. (b, bottom graph) Survival of mice with intraperitoneal injection of KFr13Tx with no treatment, PTX alone, and both PTX and SU11274. Kaplan–Meier curves, *P<0.05, log-rank test.
Figure 5
Figure 5
miR-31 expression decreased with chemosensitivity to PTX in human ovarian cancers. (a) Expression levels of miR-31 in human ovarian cancers were analyzed by real-time PCR. Cases 1–6 are chemosensitive and cases 7–12 are chemoresistant to taxane/platinum reagents. *P<0.05, unpaired one-tailed t-test. (b) Prognosis of patients of ovarian cancers classified as miR31-high (solid line) and miR31-low (broken line) group. Kaplan–Meier curves for seven FIGO stage IIIc human primary ovarian cancers depicting overall survival, stratified based on miR-31 level. *P<0.05, log-rank test. CBDCA, carboplatin; PTX, paclitaxel. Median follow-up=67 months. (c) Correlation of expression levels of miR-31 and immunohistochemical reactivity of MET. IHC score, immunohistochemistry score. Representative results of IHC with scores 4, 5 and 6 are shown as photographs, × 400; *P<0.05, single regression analysis.

Similar articles

Cited by

References

    1. Boyle P, Levin B.World cancer report 2008 World Health Organization, Lyon; 2008. 2008.
    1. Landis SH, Murray T, Bolden S, Wingo PA. Cancer statistics, 1999. CA Cancer J Clin. 1999;49:8–31. - PubMed
    1. Cannistra SA. Cancer of the ovary. N Engl J Med. 2004;351:2519–2529. - PubMed
    1. Kristensen GB, Trope C. Epithelial ovarian carcinoma. Lancet. 1997;349:113–117. - PubMed
    1. Vaughan S, Coward JI, Bast RC, Berchuck A, Berek JS, Brenton JD, et al. Rethinking ovarian cancer: recommendations for improving outcomes. Nat Rev Cancer. 2011;11:719–725. - PMC - PubMed