. 2013 Apr 4;496(7443):96-100.
doi: 10.1038/nature12015.

The emergence of functional microcircuits in visual cortex

Affiliations

The emergence of functional microcircuits in visual cortex

Ho Ko et al. Nature. .

Abstract

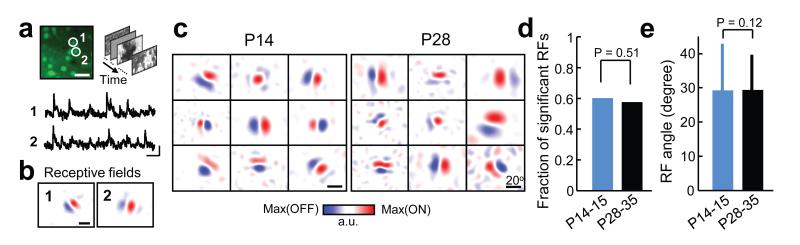
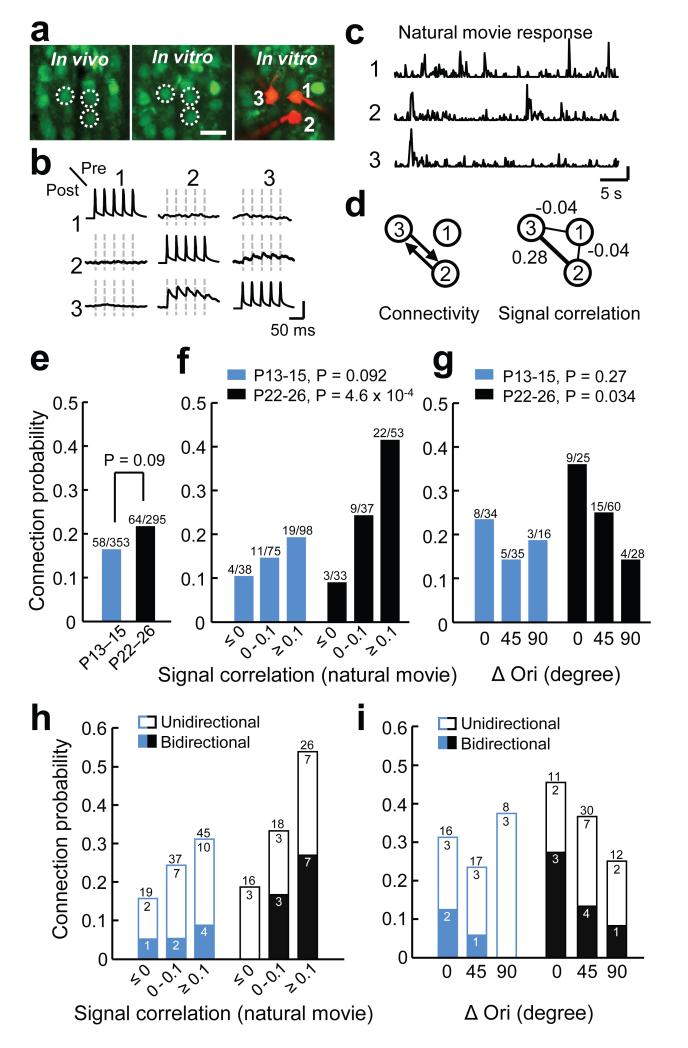
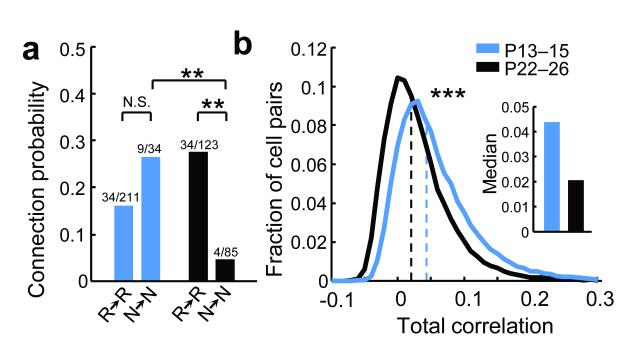
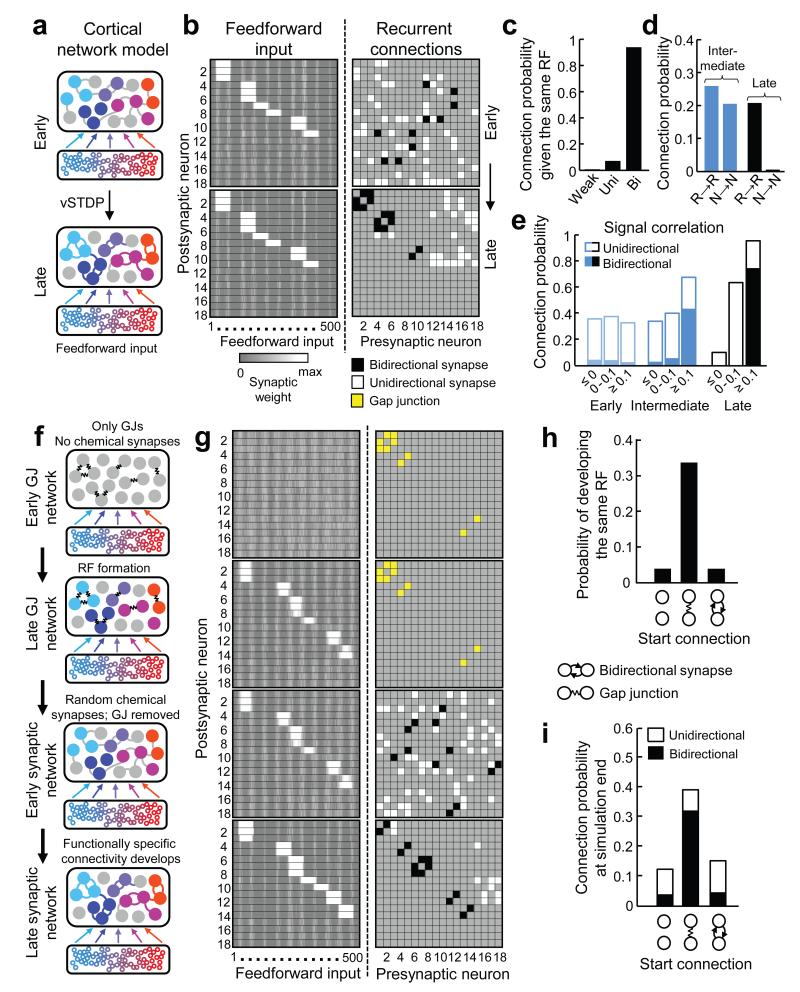
Sensory processing occurs in neocortical microcircuits in which synaptic connectivity is highly structured and excitatory neurons form subnetworks that process related sensory information. However, the developmental mechanisms underlying the formation of functionally organized connectivity in cortical microcircuits remain unknown. Here we directly relate patterns of excitatory synaptic connectivity to visual response properties of neighbouring layer 2/3 pyramidal neurons in mouse visual cortex at different postnatal ages, using two-photon calcium imaging in vivo and multiple whole-cell recordings in vitro. Although neural responses were already highly selective for visual stimuli at eye opening, neurons responding to similar visual features were not yet preferentially connected, indicating that the emergence of feature selectivity does not depend on the precise arrangement of local synaptic connections. After eye opening, local connectivity reorganized extensively: more connections formed selectively between neurons with similar visual responses and connections were eliminated between visually unresponsive neurons, but the overall connectivity rate did not change. We propose a sequential model of cortical microcircuit development based on activity-dependent mechanisms of plasticity whereby neurons first acquire feature preference by selecting feedforward inputs before the onset of sensory experience--a process that may be facilitated by early electrical coupling between neuronal subsets--and then patterned input drives the formation of functional subnetworks through a redistribution of recurrent synaptic connections.


Figures

Figure 1
Figure 1. Responses of layer 2/3 pyramidal cells in mouse visual cortex are highly feature selective at eye-opening
a, Example of OGB-labelled region at P14 (left, scale bar, 30 μm) with calcium transients of two cells obtained with two-photon microscopy (below, scale bars, 20 s, 10 % ΔF/F) in response to natural image sequences. b, Linear receptive fields (RFs) of the neurons in a obtained by regularized reverse correlation (see Methods); scale bars, 20°. c, RFs of neurons from two mice at different ages. d,e, Fractions of neurons with significant RFs (d, chi-squared test) and RF size (e, rank-sum test) at eye-opening and in more mature V1. Error bars show s.d.; n = 4 mice P14 – 15, 5 mice P28 – 35.
Figure 2
Figure 2. Functionally specific connectivity between L2/3 pyramidal cells is not apparent at eye opening
a, Example triplet of neurons shown in a transformed in vivo image (left), the same neurons in the brain slice (middle) and during whole-cell recordings (right); scale bar, 30 μm. b, Membrane potential recordings from neurons shown in a. Evoked spikes and average traces of postsynaptic potentials. Dashed lines indicate timing of presynaptic spikes. Scale bars, 80 mV, 0.8 mV. c, Peristimulus time histogram of spikes inferred from calcium signals of the three neurons in response to a natural movie sequence (averages of six repetitions); scale bar 0.02 a.u. d, Schematics of synaptic connectivity and in vivo signal correlations during natural movies for the three neurons. e, Overall connectivity rates at eye-opening and in more mature V1; Chi-squared test. f, Relationship between connection probability and signal correlation of neuronal pairs significantly responsive to the natural movie across age; Cochran-Armitage test. g, Relationship between connection probability and difference in preferred orientation (ΔOri) among pairs in which both neurons were responsive and orientation selective (OSI > 0.4). h,i, The probability of observing uni- or bidirectionaly connected pairs as function of either signal correlation (h) or ΔOri (i); n = 13 mice at P13 – 15, and 18 mice at P22 – 26.
Figure 3
Figure 3. Developmental elimination of recurrent connections between non-responsive neurons
a, Connection probability between neurons significantly responsive to the natural movie (R→R) and between non-responsive neurons (N→N) at two ages; ** indicates P < 0.01, Tukey’s HSD multiple comparison test among proportions. b, Distribution of pair-wise time-varying inferred firing rate correlation coefficients for all responsive cell pairs (to natural movies) separated by < 50 μm; *** indicates P < 10−307, rank-sum test).
Figure 4
Figure 4. Feedforward input structure determines the functional organization of recurrent connectivity
a, Schematic of the network model of functional microcircuit development based on voltage-based spike-timing dependent plasticity (vSTDP) (see text for details). At simulation start, cortical neurons were randomly connected, but received spatially clustered input from a subset of presynaptic neurons. Both feedforward and recurrent connections were updated via the vSTDP rule (see Methods). b, Synaptic weight matrices of feedforward (left, reordered for display purposes) and recurrent (right) connections from an example network at the beginning and end of the simulation. Recurrent synaptic connections were classified as weak (light grey), unidirectional (white) and bidirectional (black). c, Probability of observing weak, uni- or bidirectional connections at simulation end between neurons that start with the same RF. d, Connection probability of responsive (R→R) and non-responsive (N→N) neuronal pairs during and at the end of the simulation. e, Relationship between connection probability and feed-forward input-driven signal correlation at three time points in the simulation. f, Schematic of different stages of network model extended earlier in development. g, Synaptic weight matrices from example gap-junction network model. The recurrent network is initially connected with GJs (yellow) in the absence of chemical synapses. With time, neurons selected a spatially clustered set of feedforward inputs (RFs). Gap junctions were then removed and recurrent chemical connections were randomly assigned. The simulation was then continued as in a and b. h, Probability of developing RFs from the same set of feedforward inputs for pairs with no recurrent connections, GJs or early bidirectional connections (data from separate simulations) at the start of the simulation. i, Probability of developing shared connections depended on the starting connectivity. Data in c,d,e,h,i are from 50 network simulations.

Comment in

References

    1. Binzegger T, Douglas RJ, Martin KAC. A quantitative map of the circuit of cat primary visual cortex. J. Neurosci. 2004;24:8441–8453. - PMC - PubMed
    1. Song S, Sjöström PJ, Reigl M, Nelson S, Chklovskii DB. Highly nonrandom features of synaptic connectivity in local cortical circuits. PLoS Biol. 2005;3:e68. - PMC - PubMed
    1. Brown SP, Hestrin S. Intracortical circuits of pyramidal neurons reflect their long-range axonal targets. Nature. 2009;457:1133–1136. - PMC - PubMed
    1. Perin R, Berger TK, Markram H. A synaptic organizing principle for cortical neuronal groups. Proc. Natl. Acad. Sci. U.S.A. 2011;108:5419–5424. - PMC - PubMed
    1. Ko H, et al. Functional specificity of local synaptic connections in neocortical networks. Nature. 2011;473:87–91. - PMC - PubMed

Methods References

    1. Nimmerjahn A, Kirchhoff F, Kerr JND, Helmchen F. Sulforhodamine 101 as a specific marker of astroglia in the neocortex in vivo. Nat. Methods. 2004;1:31–37. - PubMed
    1. Brainard DH. The Psychophysics Toolbox. Spat Vis. 1997;10:433–436. - PubMed
    1. Pelli DG. The VideoToolbox software for visual psychophysics: transforming numbers into movies. Spat Vis. 1997;10:437–442. - PubMed
    1. Vogelstein JT, et al. Fast nonnegative deconvolution for spike train inference from population calcium imaging. J. Neurophysiol. 2010;104:3691–3704. - PMC - PubMed
    1. Ringach DL. Mapping receptive fields in primary visual cortex. J. Physiol. (Lond.) 2004;558:717–728. - PMC - PubMed

Publication types