. 2013 Jun;227(2):161-74.
doi: 10.1007/s00221-013-3496-2. Epub 2013 Apr 4.

Following and intercepting scribbles: interactions between eye and hand control

Affiliations

Following and intercepting scribbles: interactions between eye and hand control

Leigh A Mrotek. Exp Brain Res. 2013 Jun.

Abstract

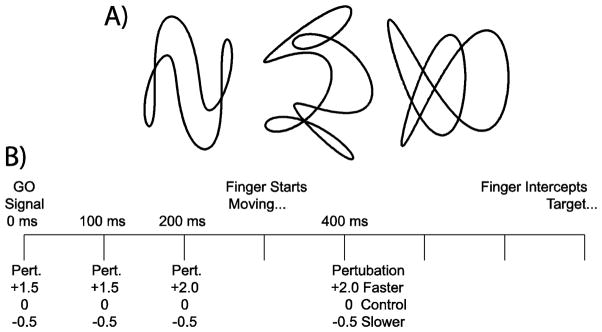
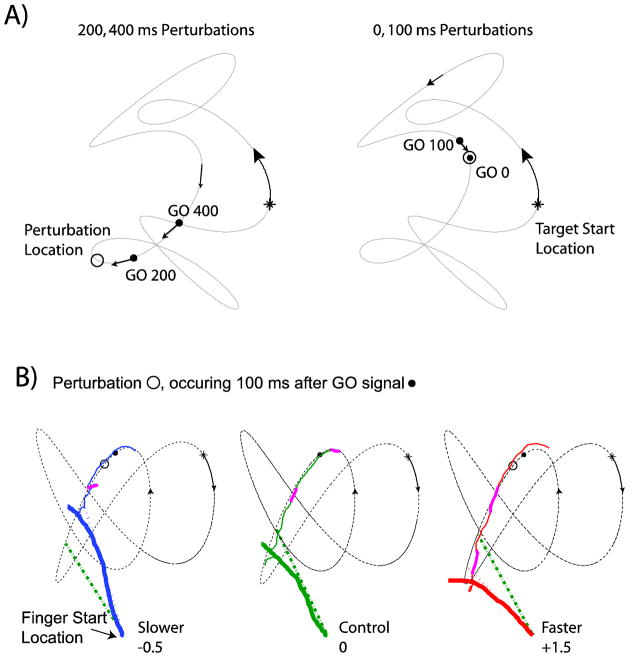
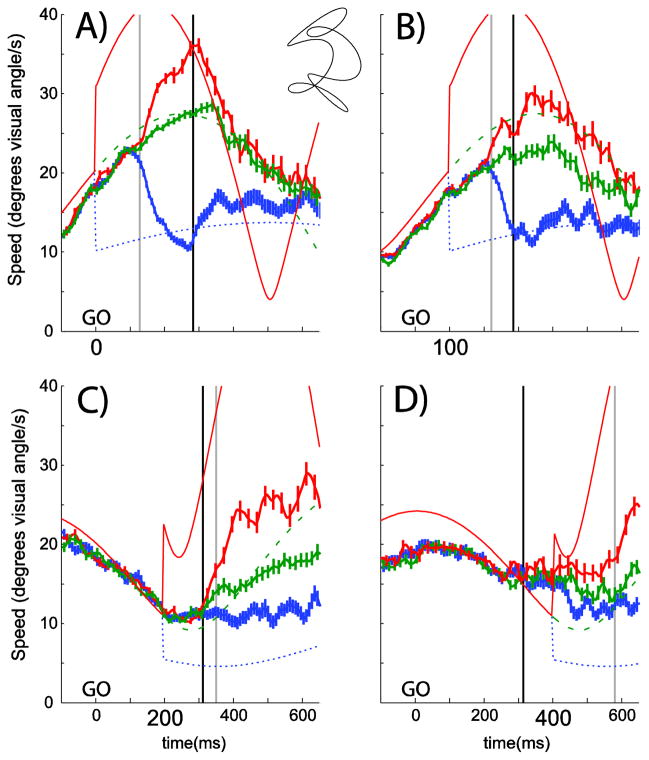
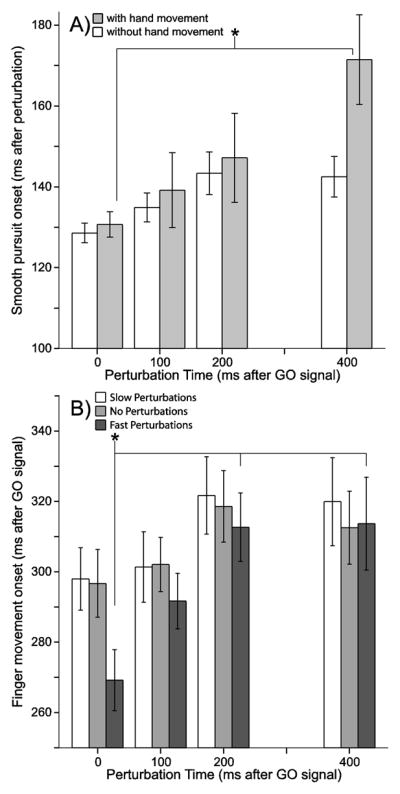
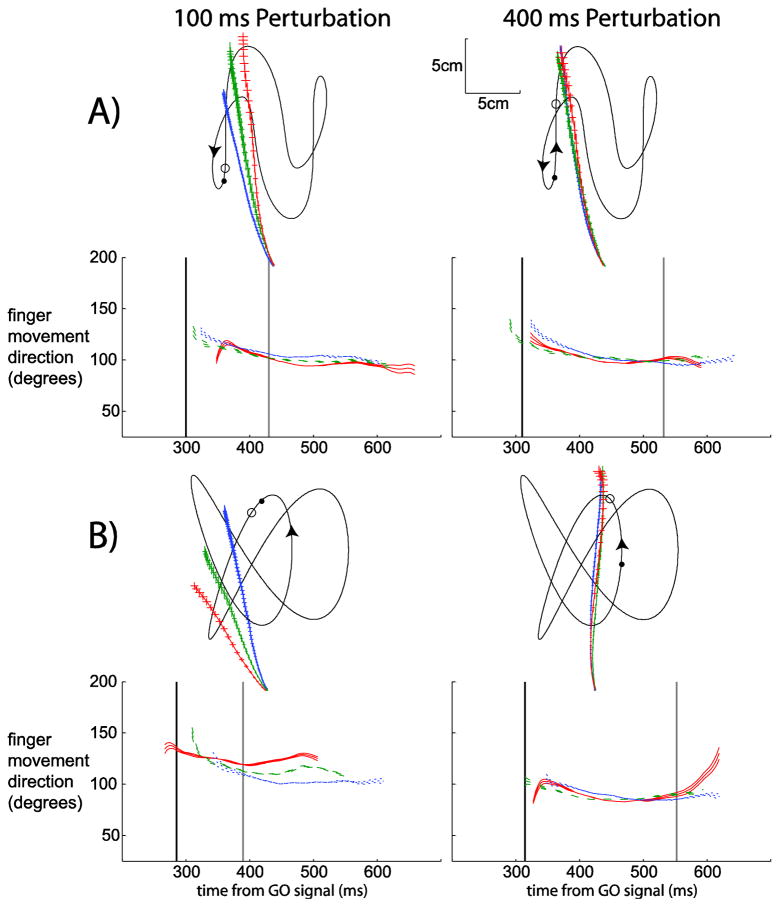
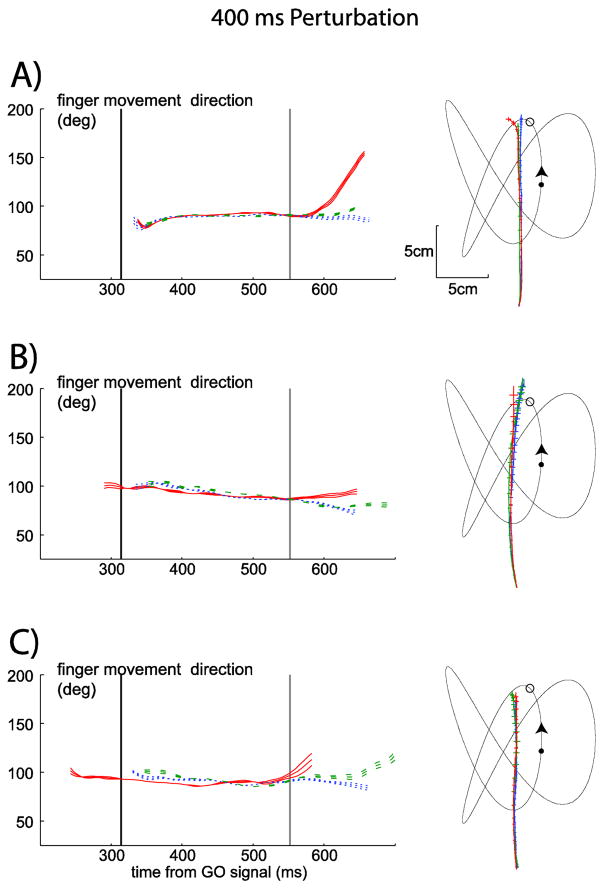
The smooth pursuit eye movement system appears to be importantly engaged during the planning and execution of interceptive hand movements. The present study sought to probe the interaction between eye and hand control systems by examining their responses during an interception task that included target speed perturbations. On 2/3 of trials, the target increased or decreased speed at various times, ranging from about 300 ms before to 150 ms after the onset of a finger movement directed to intercept the target and was triggered by a GO signal. Additionally, the same 2D sum-of-sines target trajectories were followed with the eyes without interception. The smooth pursuit system responded more quickly if the target speed perturbation occurred earlier during the reaction time (i.e., near the time of the GO signal). Similarly, the finger movement began more quickly if target speed was increased earlier during the reaction time. For early perturbation conditions, the initial direction of the finger movement matched the predicted target intercept using the new target speed. For perturbations occurring after finger movement, onset initial direction of finger movement did not match target interception such that the finger path began to curve toward the perturbed target after about 150-200 ms. The results support the idea of an active process of visual target path extrapolation simultaneously used to guide both the eye and hand.


Figures

Figure 1
Figure 1
Experimental design. A) The three target paths used for both interception and control sessions in the 100, 200 and 400 ms conditions are shown. These three paths were rotated (90° counterclockwise) and reversed (along the vertical axis) in 0 ms condition to prevent familiarity with the trajectories. B) The timeline indicates possible speed perturbation events for all experimental conditions. Fast or slow perturbations could occur at the same time as the GO signal (which is 0 ms throughout the text) or 100, 200 or 400 ms after. Subjects began the interception movement approximately 300 ms after the GO signal and if successful intercepted the target approximately 400 ms later.
Figure 2
Figure 2
Examples of trial events. A) The 200 and 400 ms perturbations were intermixed in a single data collection for half the subjects (with 0 and 200 ms intermixed for the other half of the subjects). Note that within the conditions in each panel of the figure the perturbation location remained consistent. Also, for a given subject the conditions in a single data collection remained consistent for interception and control sessions. Initial target location is represented by the asterisk and moved in the direction of the arrows along the trajectory without leaving a trace. When it reached the location of the GO signal (filled black circle) it changed from cyan to yellow to indicate to the subject to begin the interception movement. Abrupt speed changes could occur when the target reached the positions marked with the open circle. The target continued along the trajectory until it was successfully intercepted or it completed two full rotations of the trajectory (10 seconds). B) Target, eye and finger data from three individual trials (Subject 2). The target started at the asterisk and moved along the thin, dashed, black line in the direction indicated by the arrows. The GO signal was located at the filled black dot and if there was a perturbation it occurred at the location of the open circle. Smooth pursuit (thin solid colored lines near the target trajectory) from 200 ms before the GO signal to the time of interception follows along the target path, occasionally interrupted by saccades (solid thicker magenta lines). The path of the finger is shown with the thickest solid line, and is color-coded for the slower perturbation (−0.5, blue, left panel), the faster perturbation (+1.5, red, right panel) and the control situation (0, green, center panel). Since there was no requirement to stop at the target, this subject chose a strategy where her finger continued past the interception location, which is why in all three trials the finger movement path extends past the target trajectory. In each case the straight dashed lines that begin at the finger start location point ~150 ms ahead of where the target was when the finger started moving. In all panels the green dashed-dotted line represents the prediction if the perturbation was not included and the colored dotted line (blue, red) represents if the prediction took the perturbation into account. All panels in B) are from interception sessions.
Figure 3
Figure 3
Smooth pursuit speed for all subjects, perturbation magnitude conditions and one path (inset between A and B) during interception sessions. Speed (of the target and gaze) is on the y-axis and time is on the x-axis. Target speed is shown with the thin lines and the various perturbation magnitudes are delineated by different line colors and styles. The target speed for the slow perturbation condition is shown with the thin blue dotted line. The no perturbation condition target speed is shown with the thin green dashed lines and the fast perturbation condition target speed is shown with the thin solid red lines. Average smooth pursuit speed (with ±1SEM hatching) is shown with the thicker colored lines. Data from the slow perturbation condition are shown with the blue lines with the most hatching. Data from the no perturbation condition are shown with the green lines with the intermediate amount of hatching and data from the fast perturbation conditions are shown with the red lines and the least hatching. Each panel features a different perturbation time condition: A=0 ms, B=100 ms, C=200 ms, D=400 ms. The trials were aligned on the time of the GO signal and this is depicted as time zero for each panel. The thick vertical gray line shows the average time when smooth pursuit responded to the change in target speed for that particular perturbation time condition for that trajectory. The thick vertical black lines show the time of finger movement onset for that particular perturbation time condition for that trajectory.
Figure 4
Figure 4
A) Quantification of reaction times (y-axis) for the response of smooth pursuit speed to a change in target speed for each perturbation time condition (x-axis). The shaded bars depict data from sessions with both eye and finger movement (interception sessions); the white bars refer to sessions which served as the eye-only control experiments (no finger movement). The white bars are not significantly different from each other. The shaded bar in the 400 ms perturbation condition is significantly different from that in the 0 ms perturbation condition. B) Reaction time (y-axis) for the finger interception movement for each perturbation time condition (x-axis) and for each perturbation magnitude (bar color coded). White bars represent data from the slow perturbation condition. Light gray bars represent the data from the no perturbation condition. Dark gray bars represent the data from fast perturbation conditions. The asterisked conditions are significantly different from each other (i.e. the 0 ms condition is different from the 200ms and 400ms conditions).
Figure 5
Figure 5
Changes in the path and direction of finger movement, in response to changes in target speed during interception sessions. Parts A and B show examples from two different paths for one subject (Subject 8). The left column depicts the 100 ms perturbation condition and the right column depicts the 400 ms perturbation condition. In the top panel of each part of the figure the target trajectory is shown for this condition (black thin lines). The target followed the trajectory along the direction shown by the arrows. The GO signal is represented by the solid black circle and the perturbation location (if there was one) is shown with the open circle. The finger average movement paths for this one subject in the one trajectory are shown emanating from the bottom of this aspect of the figure. Average finger movement paths are shown for all three perturbation magnitude conditions. In the bottom panel in each part of the figure the finger direction over time for each perturbation magnitude condition is shown over the time of the trial for the current target trajectory. Time zero is the time of the GO signal (not shown). The finger movement directions are color-coded and have varying line style; for the slower perturbation (−0.5, blue dotted lines for finger direction, blue line with the most hatching for finger position), the faster perturbation (+1.5, red solid line for finger direction and red line with the least hatching for finger position) and the control situation (0, green dashed line for finger direction and green line with intermediate hatching for finger position). Each trace is an average (±1SEM) of all successful first movement attempts in each condition. Vertical lines in each panel represent the time of finger movement onset (black) and the time finger direction separates (gray) across all subjects and all trials in the particular target trajectory and perturbation time condition.
Figure 6
Figure 6
For the 400 ms perturbation, three more examples of finger direction and finger position patterns are shown for one target trajectory. Condition average examples are shown for A) Subject 1, B) Subject 2, C) Subject 4 in interception sessions. In each panel finger movement direction (±1SEM) over the time of the trial is on the left. Time zero (not shown) is the time of the GO signal. The all subject average time of finger movement onset (black vertical lines) and the all subject average time finger direction separated (gray vertical lines) is shown for this trajectory and this perturbation time condition in each plot. On the right side, target and finger position are shown for the condition. Finger position is the condition average for each subject ±1SEM in both the horizontal and vertical dimensions. The target trajectory is represented with a thin black line, with the location of the GO signal as the black filled circle and the perturbation location with a black open circle. Arrows show the direction of target motion along the trajectory. Data from slow perturbation conditions are shown with the blue dotted lines (finger direction plots) and blue lines with the most hatching (finger position plots); data from the no perturbation conditions are shown with the green dashed lines (finger direction plots) and green lines with intermediate hatching (finger position plots); and data from the fast perturbation conditions are shown with the red solid lines (finger direction plots) and red lines with the least hatching (finger position plots).

References

    1. Barnes GR, Marsden JF. Anticipatory control of hand and eye movements in humans during oculo-manual tracking. Journal of Physiology. 2002;539:317–330. - PMC - PubMed
    1. Batista AP, Buneo CA, Snyder LH, Andersen RA. Reach plans in eye-centered coordinates. Science. 1999;285:257–260. - PubMed
    1. Bell AH, Meredith MA, Van Opstal AJ, Munoz DP. Stimulus intensity modifies saccadic reaction time and visual response latency in the superior colliculus. Experimental Brain Research. 2006;174:51–59. - PubMed
    1. Brenner E, Smeets JBJ. Fast responses of the human hand to change in target position. Journal of Motor Behavior. 1997;29:297–310. - PubMed
    1. Brenner E, Smeets JBJ, de Lussanet MHE. Hitting moving targets continuous control of the acceleration of the hand on the basis of the target’s velocity. Experimental Brain Research. 1998;122:467–474. - PubMed

Publication types

LinkOut - more resources