. 2013 Sep 10;32(20):3552-68.
doi: 10.1002/sim.5802. Epub 2013 Apr 1.

The use of propensity scores and observational data to estimate randomized controlled trial generalizability bias

Affiliations

The use of propensity scores and observational data to estimate randomized controlled trial generalizability bias

Taylor R Pressler et al. Stat Med. .

Abstract

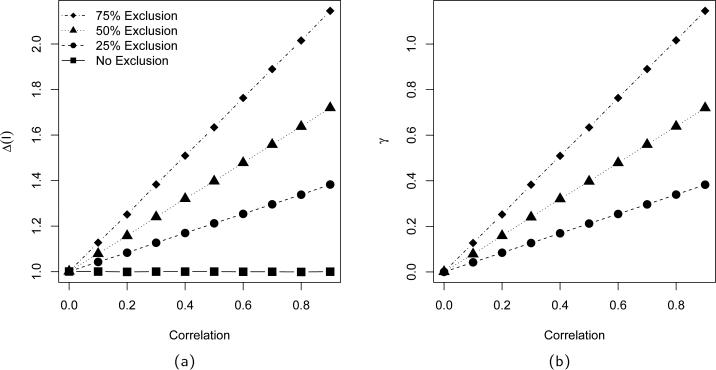
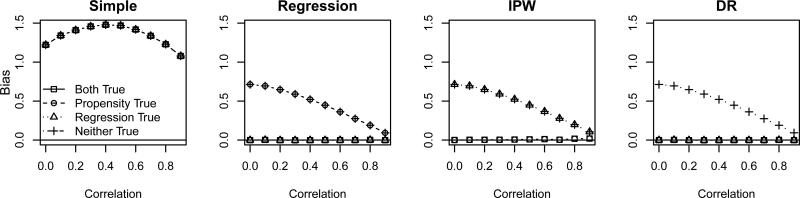
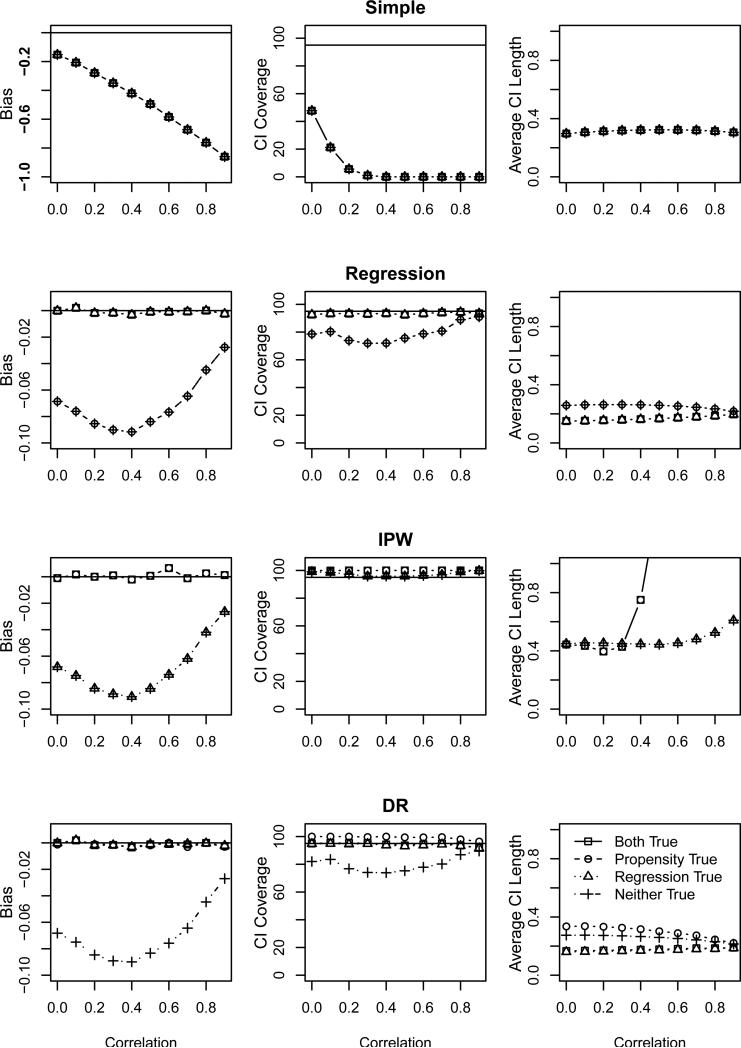
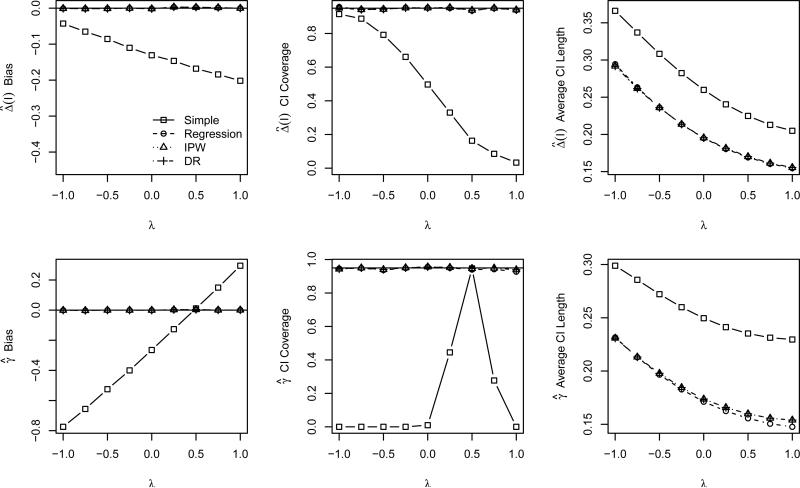
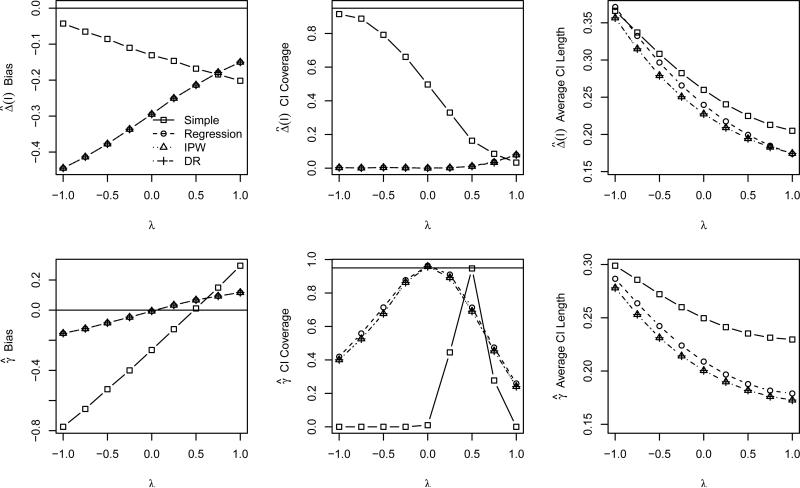
Although randomized controlled trials are considered the 'gold standard' for clinical studies, the use of exclusion criteria may impact the external validity of the results. It is unknown whether estimators of effect size are biased by excluding a portion of the target population from enrollment. We propose to use observational data to estimate the bias due to enrollment restrictions, which we term generalizability bias. In this paper, we introduce a class of estimators for the generalizability bias and use simulation to study its properties in the presence of non-constant treatment effects. We find the surprising result that our estimators can be unbiased for the true generalizability bias even when all potentially confounding variables are not measured. In addition, our proposed doubly robust estimator performs well even for mis-specified models.

Keywords: causal effect; observational studies; propensity score; randomized controlled trials; sample selection error.


Figures

Figure 1
Figure 1
Population values for PATE (squares), SPATE(I) [panel (a)], and generalizability bias [panel (b)] as a function of covariate correlation. Values are displayed for simulations where 75% (diamonds), 50% (triangles), and 25% (circles) of the population is excluded from trial eligibility.
Figure 2
Figure 2
Bias of using Δ^(I) to estimate Δ as a function of covariate correlation, based on the first simulation study. Each panel displays results for estimates with different model mis-specifications: correct propensity and response models (squares), correct propensity model and incorrect response model (circle), incorrect propensity model and correct response model (triangle), and incorrect propensity and response models (crosses).
Figure 3
Figure 3
Properties of γ^ as a function of covariate correlation based on the first simulation study. Each panel shows the properties for four model mis-specifications: correct propensity and response models (squares), correct propensity model and incorrect response model (circles), incorrect propensity model and correct response model (triangles), and incorrect propensity and response models (crosses). The panels in each row display the properties of γ^ based on the simple, regression, IPW, and DR SPATE estimators, respectively. The panels in the leftmost column display the bias of the estimator, where the solid horizontal line indicates no bias. Note that the vertical scale for the simple estimator is larger than the others to accommodate the much larger bias. The center column panels display the CI coverage, where the solid horizontal line indicates the nominal 95% level, and the rightmost column panels display the average CI length.
Figure 4
Figure 4
Bias of using Δ^(I) to estimate Δ (first row) and properties of γ^ (second row) as a function of covariate correlation based on the second simulation study and correct model specifications. Each panel displays results for each of the four estimators: simple (squares), regression (circle), IPW (triangle), and DR (diamonds). The panels in the leftmost column display the bias of the estimator, where the solid horizontal line indicates no bias. The center column panels display the CI coverage, where the solid horizontal line indicates the nominal 95% level, and the rightmost column panels display the average CI length.
Figure 5
Figure 5
Bias of using Δ^(I) to estimate Δ (first row) and properties of γ^ (second row) as a function of covariate correlation based on the second simulation study and incorrect propensity and respse model specifications. Each panel displays results for each of the four estimators: simple (squares), regression (circle), IPW (triangle), and DR (diamonds). The panels in the leftmost column display the bias of the estimator, where the solid horizontal line indicates no bias. The center column panels display the CI coverage, where the solid horizontal line indicates the nominal 95% level, and the rightmost column panels display the average CI length.

Comment in

References

    1. Stirman SW, DeRubeis RJ, Crits-Christoph P, Brocly PE. Are samples in randomized controlled trials of psychotherapy representative of community outpatients? A new methodology and initial findings. Journal of Consulting and Clinical Psychology. 2003;71(6):963–972. DOI: 10.1037/0022-006X.71.6.963. - PubMed
    1. Greenhouse JB, Kaizar EE, Kelleher K, Seltman H, Gardner W. Generalizing from clinical trial data: a case study. The risk of suicidality among pediatric antidepressant users. Statistics in Medicine. 2008;27:1801–1813. DOI: 10.1002/sim.3218. - PMC - PubMed
    1. Humphreys K, Weisner C. Use of exclusion criteria in selecting research subjects and its effect on the generalizability of alcohol treatment outcome studies. American Journal of Psychiatry. 2000;157:588–594. - PubMed
    1. Zimmerman M, Chelminski I, Posternak MA. Exclusion criteria used in antidepressant efficacy trials: consistency across studies and representativeness of samples included. Journal of Nervous and Mental Disease. 2004;192:87–94. - PubMed
    1. Fortin M, Dionne J, Phiho G, Gignac J, Almirall J, Lapointe L. Randomized controlled trials: do they have external validity for patients with multiple comorbidities? Annals of Family Medicine. 2006;4:104–108. DOI: 10.1370/afm.516. - PMC - PubMed

Publication types

LinkOut - more resources