

Hepatic macrophages but not dendritic cells contribute to liver fibrosis by promoting the survival of activated hepatic stellate cells in mice
- PMID: 23553591
- PMCID: PMC3848418
- DOI: 10.1002/hep.26429
Hepatic macrophages but not dendritic cells contribute to liver fibrosis by promoting the survival of activated hepatic stellate cells in mice
Abstract
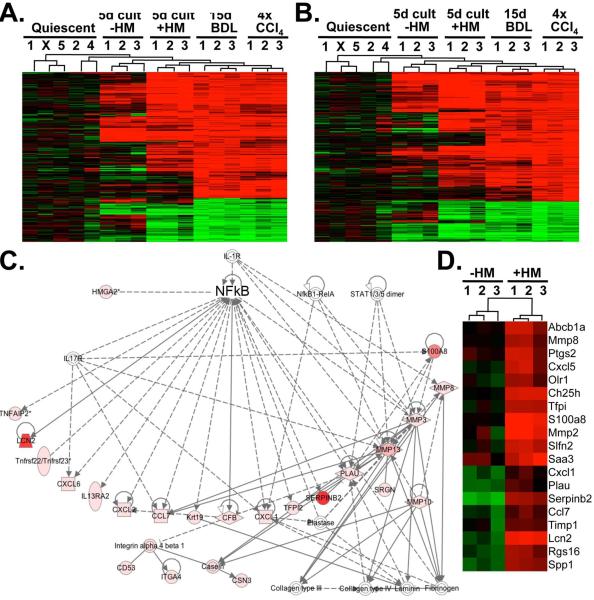
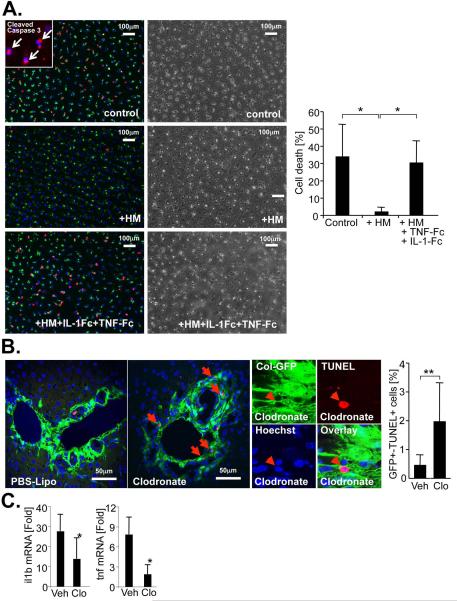
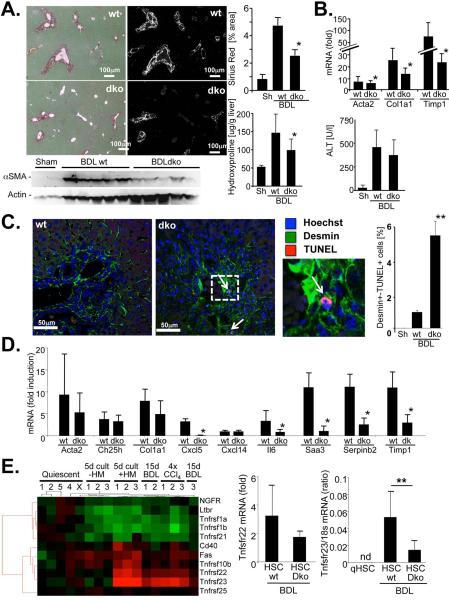
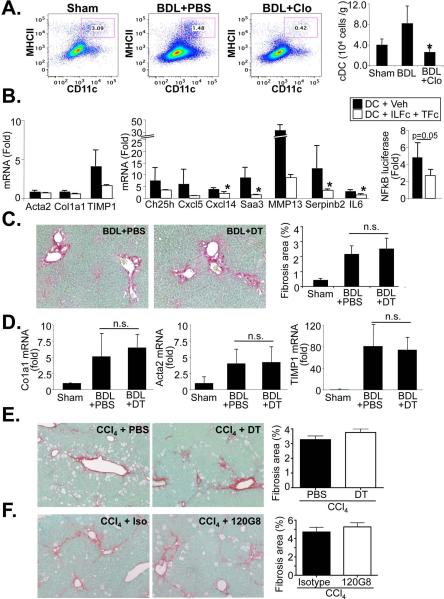
Although it is well established that hepatic macrophages play a crucial role in the development of liver fibrosis, the underlying mechanisms remain largely elusive. Moreover, it is not known whether other mononuclear phagocytes such as dendritic cells (DCs) contribute to hepatic stellate cell (HSC) activation and liver fibrosis. We show for the first time that hepatic macrophages enhance myofibroblast survival in a nuclear factor kappa B (NF-κB)-dependent manner and thereby promote liver fibrosis. Microarray and pathway analysis revealed no induction of HSC activation pathways by hepatic macrophages but a profound activation of the NF-κB pathway in HSCs. Conversely, depletion of mononuclear phagocytes during fibrogenesis in vivo resulted in suppressed NF-κB activation in HSCs. Macrophage-induced activation of NF-κB in HSCs in vitro and in vivo was mediated by interleukin (IL)-1 and tumor necrosis factor (TNF). Notably, IL-1 and TNF did not promote HSC activation but promoted survival of activated HSCs in vitro and in vivo and thereby increased liver fibrosis, as demonstrated by neutralization in coculture experiments and genetic ablation of IL-1 and TNF receptor in vivo. Coculture and in vivo ablation experiments revealed only a minor contribution to NF-κB activation in HSCs by DCs, and no contribution of DCs to liver fibrosis development, respectively.
Conclusion: Promotion of NF-κB-dependent myofibroblast survival by macrophages but not DCs provides a novel link between inflammation and fibrosis.
Copyright © 2013 by the American Association for the Study of Liver Diseases.
Figures
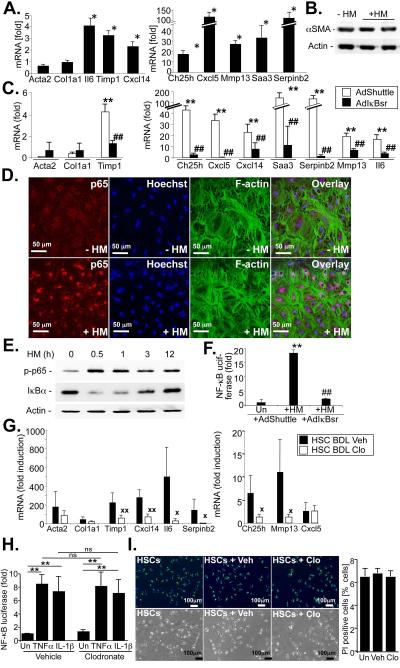
 p<0.05,
  p<0.01 vs HSC BDL Veh.
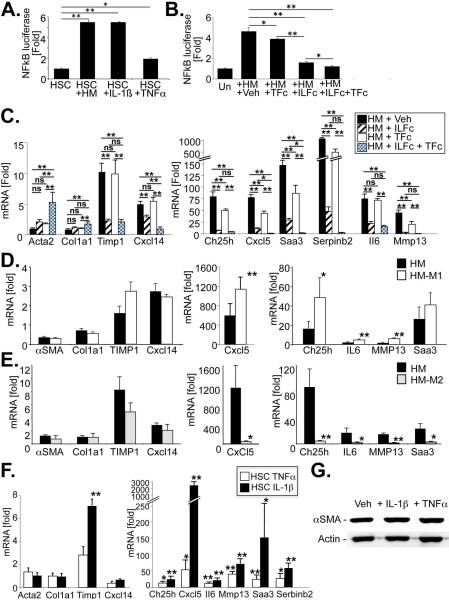
References
-
- Maher JJ. Interactions between hepatic stellate cells and the immune system. Semin Liver Dis. 2001;21:417–426. - PubMed
Publication types
MeSH terms
Substances
Grants and funding
LinkOut - more resources
Full Text Sources
Other Literature Sources
Medical
Molecular Biology Databases