. 2013 May 10;288(19):13534-50.
doi: 10.1074/jbc.M113.457218. Epub 2013 Apr 3.

DNA-dependent activator of interferon-regulatory factors (DAI) promotes lupus nephritis by activating the calcium pathway

Affiliations

DNA-dependent activator of interferon-regulatory factors (DAI) promotes lupus nephritis by activating the calcium pathway

Weijuan Zhang et al. J Biol Chem. .

Abstract

Background: Macrophage M2b polarization conferred by self-DNA immunization initiates and propagates lupus nephritis.

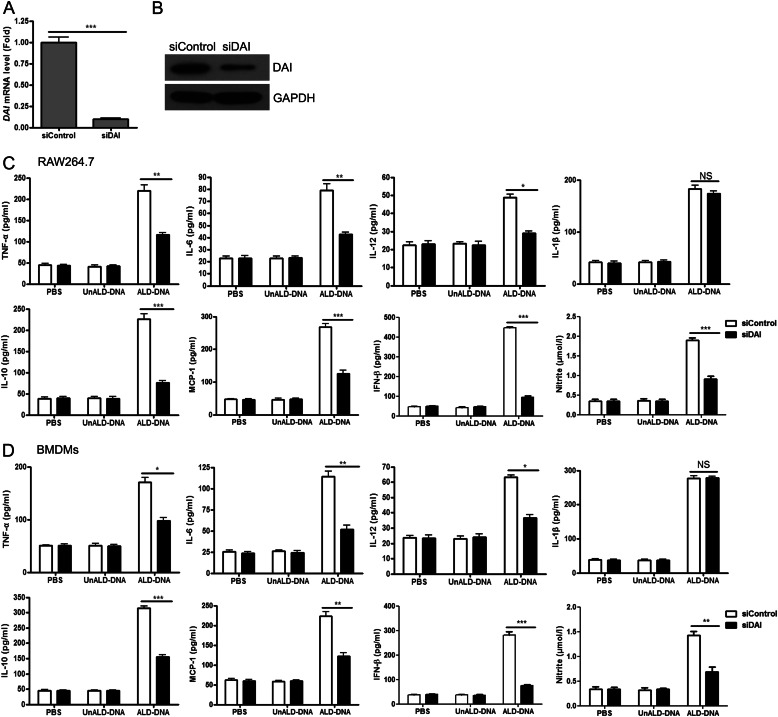
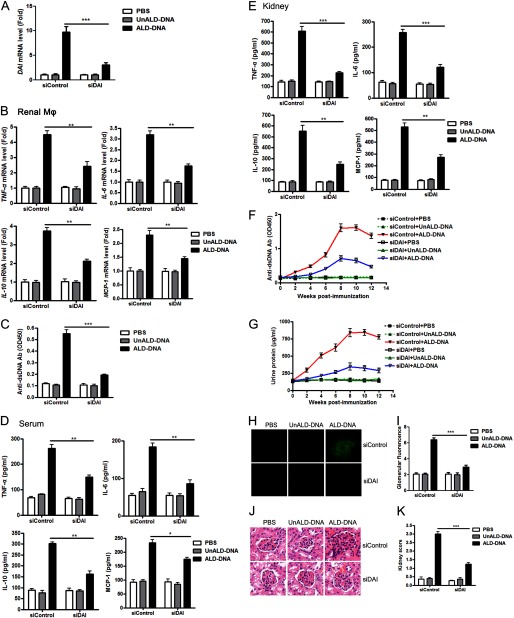
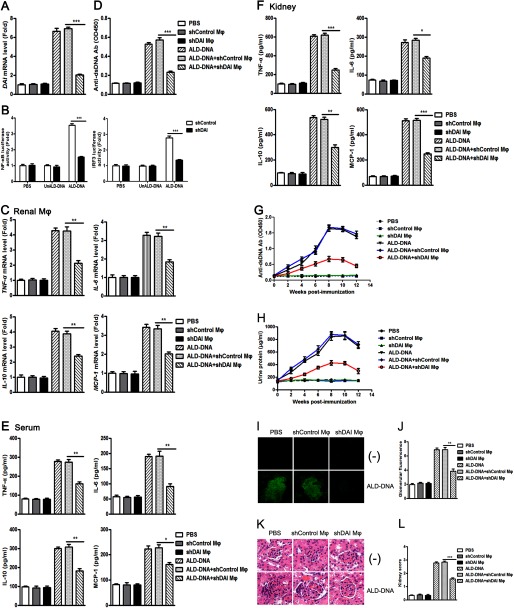
Results: Knockdown of DNA-dependent activator of interferon-regulatory factors (DAI) ameliorates SLE syndrome via blunting macrophage M2b polarization.

Conclusion: DAI functions as a DNA sensor in self-DNA-induced macrophage M2b polarization and lupus nephritis.

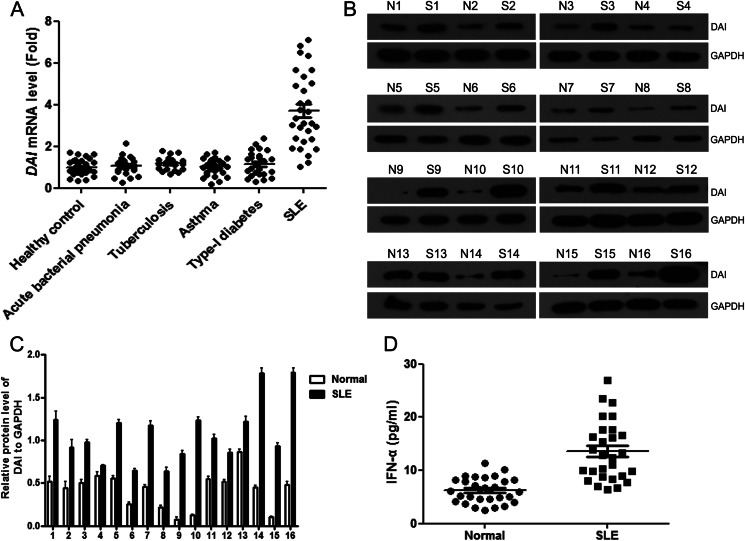
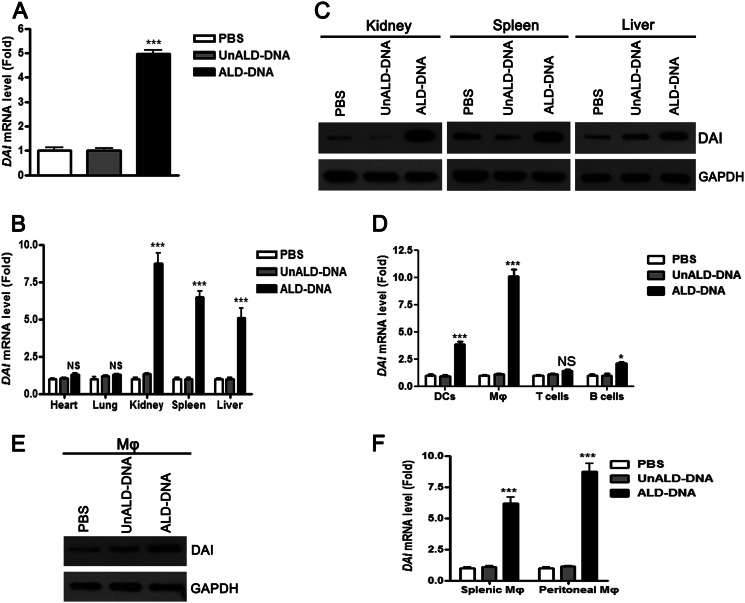
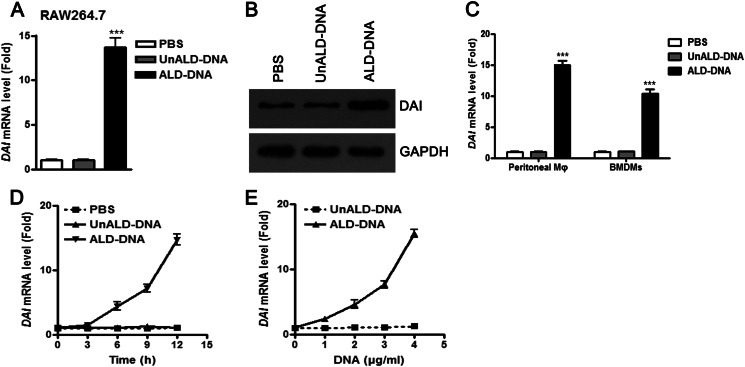
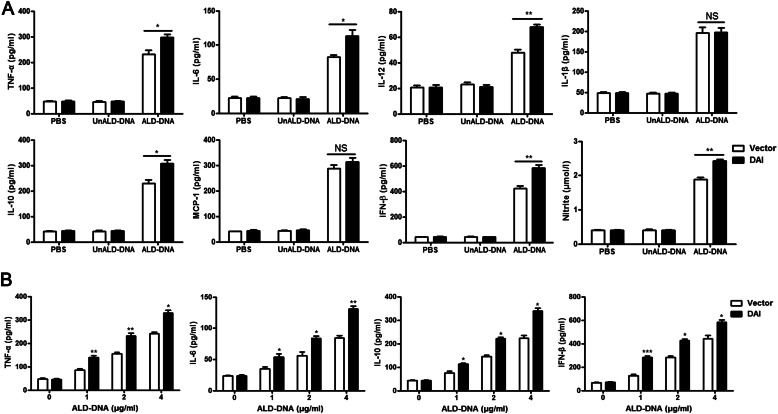
Significance: We disclose the mechanism by which self-DNA induces macrophage M2b polarization and lupus nephritis DNA-dependent activator of interferon-regulatory factors (DAI) functions as a cytoplasmic DNA sensor that activates the innate immune system. We previously found that activated lymphocyte-derived self-apoptotic DNA (ALD-DNA) immunization led to pathological macrophage activation and M2b polarization, which could initiate and propagate murine lupus nephritis. However, the specific DNA sensor(s) as well as underlying molecular mechanisms involved in ALD-DNA-induced macrophage M2b polarization in systemic lupus erythematosus (SLE) disease remains unknown. In this study, we reported that DAI expression was significantly increased in SLE patients as well as in lupus mice. Gain- and loss-of-function studies revealed that DAI was involved in ALD-DNA-induced macrophage activation and M2b polarization. Moreover, ALD-DNA notably induced dimerization/oligomerization of DAI and consequently activation of nuclear factor κB (NF-κB) and interferon regulatory factor 3 (IRF3) signaling pathways via calcium signaling, resulting in macrophage activation and M2b polarization. More importantly, blockade of DAI in vivo or selective knockdown of DAI in macrophages could ameliorate SLE syndrome via blunting macrophage M2b polarization and inhibiting inflammatory response in lupus mice. Our results suggest that DAI could function as a DNA sensor and a regulator in ALD-DNA-induced macrophage M2b polarization and lupus nephritis, providing the possible molecular mechanisms involved in ALD-DNA-induced macrophage M2b polarization in SLE disease and making DAI as a potential therapeutic target for the treatment of SLE.

Keywords: Autoimmune Diseases; Calcium; DAI (DLM-1/ZBP1); DNA Sensor; Inflammation; Innate immunity; Lupus Nephritis; Macrophage Polarization; Macrophages; Systemic Lupus Erythematosus (SLE).


Figures

FIGURE 1.
FIGURE 1.
DAI expression is notably increased in PBMCs of SLE patients. A, real-time PCR analysis of DAI mRNA levels in PBMCs from healthy normal controls (n = 30), patients with acute bacterial pneumonia (n = 25), tuberculosis (n = 20), asthma (n = 26), type-I diabetes (n = 25), and SLE (n = 30). B, Western blot analysis of DAI protein levels in PBMCs from SLE patients (S) and relative healthy normal controls (N). Data are representative of results obtained in three independent experiments, n = 16. C, graphical representations of band intensities in B. Expression of DAI was normalized to GAPDH expression. D, levels of IFN-α in serum of SLE patients and healthy normal controls were determined by ELISA. Data are mean ± S.E. of three independent experiments.
FIGURE 2.
FIGURE 2.
DAI expression is remarkably up-regulated in ALD-DNA-immunized lupus mice. Six- to eight-week-old female BALB/c mice were immunized subcutaneously with PBS, UnALD-DNA (50 μg/mouse), or ALD-DNA (50 μg/mouse) for a total of 3 times in 4 weeks. 8 weeks later, mice were sacrificed and surgically resected hearts, lungs, kidneys, spleens, and kidneys were collected for further analysis. A, DAI mRNA levels in PBMCs from ALD-DNA-immunized lupus mice and controls were analyzed by real-time PCR. B, DAI mRNA levels in lymphocytes of hearts, lungs, kidneys, spleens, and livers from ALD-DNA-immunized lupus mice and controls were analyzed by real-time PCR. C, DAI protein levels in lymphocytes of kidneys, spleens, and livers from ALD-DNA-immunized lupus mice and controls were analyzed by Western blot. D, DAI mRNA levels in dendritic cells (DC), Mϕ (macrophages), T cells, and B cells of kidneys from ALD-DNA-immunized lupus mice and controls were analyzed by real-time PCR. E, DAI protein levels in renal macrophages from ALD-DNA-immunized lupus mice and controls were determined by Western blot. F, DAI mRNA levels in splenic Mϕ and peritoneal Mϕ from ALD-DNA-immunized lupus mice and controls were analyzed by real-time PCR.
FIGURE 3.
FIGURE 3.
DAI expression is significantly up-regulated in macrophages upon ALD-DNA stimulation in vitro. A and B, RAW264.7 cells were stimulated with PBS, UnALD-DNA (4 μg/ml), or ALD-DNA (4 μg/ml). A, 12 h later, DAI mRNA levels in the macrophages were detected by real-time PCR. B, 24 h later, DAI protein levels in the macrophages were determined by Western blot. Data are representative of results obtained in three independent experiments. C, peritoneal macrophages and BMDMs were stimulated with PBS, UnALD-DNA (4 μg/ml), and ALD-DNA (4 μg/ml) for 12 h. DAI mRNA levels in the macrophages were detected by real-time PCR. D and E, DAI mRNA levels in RAW264.7 cells stimulated with ALD-DNA (4 μg/ml) for the indicated time (D) or with increasing amounts of ALD-DNA for 12 h (E) were determined by real-time PCR. Data are mean ± S.E. of three independent experiments. ***, p < 0.001.
FIGURE 4.
FIGURE 4.
Knockdown of DAI blocks ALD-DNA-induced macrophage activation in vitro. A and B, RAW264.7 cells were transfected with a plasmid vector encoding siControl or siDAI, stimulated with ALD-DNA (4 μg/ml), and then subjected to real-time PCR (A) and Western blot analysis (B) to evaluate the expression of DAI. Data in B are representative of results obtained in three independent experiments. C and D, RAW264.7 cells (C) and BMDMs (D) were transfected with siControl or siDAI, and treated with PBS, UnALD-DNA (4 μg/ml), or ALD-DNA (4 μg/ml) for 24 h. Levels of TNF-α, IL-6, IL-12, IL-1β, IL-10, MCP-1, IFN-β, and nitrite (the inducible NO synthase, iNOS) in the culture supernatants of macrophages were measured by ELISA. Data are mean ± S.E. of three independent experiments. *, p < 0.05; **, p < 0.01; ***, p < 0.001; NS, not significant.
FIGURE 5.
FIGURE 5.
Overexpression of DAI promotes ALD-DNA-induced macrophage activation. RAW-Vector and RAW-DAI cells were stimulated with ALD-DNA, UnALD-DNA, or PBS. A, 24 h after stimulation, levels of TNF-α, IL-6, IL-12, IL-1β, IL-10, MCP-1, IFN-β, and nitrite (the inducible NO synthase, iNOS) in the culture supernatants were measured by ELISA. B, RAW-Vector and RAW-DAI cells were stimulated with increasing amounts of ALD-DNA for 24 h, and cytokine expression levels of TNF-α, IL-6, IL-10, and IFN-β in the culture supernatants were measured by ELISA. Data are mean ± S.E. of three independent experiments. *, p < 0.05; **, p < 0.01; ***, p < 0.001; NS, not significant.
FIGURE 6.
FIGURE 6.
ALD-DNA induces dimerization/oligomerization of DAI and consequently activates DAI signaling pathways. A and B, dimer/oligomer formation of DAI by ALD-DNA stimulation. HA-tagged DAI (HA-DAI) and FLAG-tagged DAI (FLAG-DAI) were transiently coexpressed in HEK293 cells. The cells were stimulated with ALD-DNA (4 μg/ml) for the indicated periods (A) or stimulated with increasing amounts of ALD-DNA for 2 h (B) and analyzed by immunoprecipitation (IP) with anti-HA antibody, followed by immunoblotting with anti-FLAG (upper) and anti-HA (lower) antibodies. C, HEK293 cells were infected with 0.1 μg of pNF-κB-Luc, plus increasing amounts of pDAI, then left stimulated with UnALD-DNA (1 μg/ml) or ALD-DNA (1 μg/ml). Luciferase activities were measured and normalized to Renilla luciferase activities. D, HEK293 cells were infected with 0.1 μg of pNF-κB-Luc, plus 0.1 μg of pDAI, then left stimulated with increasing amounts of UnALD-DNA or ALD-DNA. Luciferase activities were measured and normalized to Renilla luciferase activities. E, HEK293 cells were infected with 0.1 μg of pIRF3-Luc, plus increasing amounts of pDAI, then left stimulated with UnALD-DNA (1 μg/ml) or ALD-DNA (1 μg/ml). Luciferase activities were measured and normalized to Renilla luciferase activities. F, HEK293 cells were infected with 0.1 μg of pIRF3-Luc, plus 0.1 μg of pDAI, then left stimulated with increasing amounts of UnALD-DNA or ALD-DNA. Luciferase activities were measured and normalized to Renilla luciferase activities. G and H, macrophages treated with siDAI or siControl were infected with 0.1 μg of pNF-κB-Luc (G) or pIRF3-Luc (H), plus 0.1 μg of pDAI, then left stimulated with UnALD-DNA (1 μg/ml) or ALD-DNA (1 μg/ml). Luciferase activities were measured and normalized to Renilla luciferase activities. Data are representative of results obtained in three independent experiments.
FIGURE 7.
FIGURE 7.
Calcium signaling orchestrates DAI-mediated macrophage activation induced by ALD-DNA. A and B, HEK293 cells were infected with 0.1 μg of pNF-κB-Luc (A) or pIRF3-Luc (B), plus 0.1 μg of pDAI for 36 h. The cells were pretreated with EGTA (1 mm), BAPTA-AM (50 μm), CsA (3 μg/ml), or CGP37157 (10 μm) for 2 h, then left stimulated with UnALD-DNA (1 μg/ml) or ALD-DNA (1 μg/ml) for another 12 h. Luciferase activities were measured and normalized to Renilla luciferase activities. C and D, the siControl or siDAI-expressing macrophages were infected with 0.1 μg of pNF-κB-Luc (C) or pIRF3-Luc (D) for 36 h. The cells were pretreated with EGTA (1 mm), BAPTA-AM (50 μm), CsA (3 μg/ml), or CGP37157 (10 μm) for 2 h, then stimulated with ALD-DNA (1 μg/ml) for another 12 h. Luciferase activities were measured and normalized to Renilla luciferase activities. E, the siControl or siDAI-expressing macrophages were pretreated with EGTA (1 mm), BAPTA-AM (50 μm), CsA (3 μg/ml), or CGP37157 (10 μm) for 2 h, then stimulated with ALD-DNA (1 μg/ml) for another 24 h. ELISA analysis was performed to detect the levels of TNF-α, IL-6, and IFN-β. F and G, the siControl or siDAI-expressing macrophages were infected with 0.1 μg of pNF-κB-Luc (F) or pIRF3-Luc (G) for 36 h. The cells were pretreated with valinomycin (1 nm) or thapsigargin (20 nm) for 2 h, then stimulated with ALD-DNA (1 μg/ml) for another 12 h. Luciferase activities were measured and normalized to Renilla luciferase activities. H, the siControl or siDAI-expressing macrophages were pretreated with valinomycin (1 nm) or thapsigargin (20 nm) for 2 h, then stimulated with ALD-DNA (1 μg/ml) for another 24 h. ELISA analysis was performed to detect the levels of TNF-α, IL-6, and IFN-β. Data are mean ± S.E. of three independent experiments. **, p < 0.01; ***, p < 0.001; NS, not significant. I, the siControl or siDAI-expressing macrophages were stimulated with ALD-DNA (1 μg/ml) for 30 min. The levels of intracellular calcium were measured. J, the siControl or siDAI-expressing macrophages were stimulated with ALD-DNA (1 μg/ml) for 30 min. Western blot analysis was performed to determine the levels of CaMKII-α phosphorylation (T286). K, the RAW264.7 cells were pretreated with BAPTA-AM (50 μm) for 2 h, then left stimulated with ALD-DNA (1 μg/ml) for another 24 h. Western blot analysis was performed to determine the levels of RIP1. Data are representative of results obtained in three independent experiments.
FIGURE 8.
FIGURE 8.
Knockdown of DAI by siRNA in vivo hampers the ALD-DNA-induced macrophage activation. In vivo transfection of peritoneal cells with siDAI was performed to block the DAI expression in peritoneal macrophages in mice. A and B, the peritoneal macrophages purified from siDAI or siControl-treated mice were stimulated with ALD-DNA (4 μg/ml) in vitro. A, 12 h later, the mRNA level of DAI was analyzed by real-time PCR. B, 24 h later, levels of TNF-α, IL-6, IL-10, and MCP-1 in the culture supernatants was analyzed by ELISA. Data are mean ± S.E. of three independent experiments. *, p < 0.05; **, p < 0.01; ***, p < 0.001. C, peritoneal macrophages purified from siDAI- or siControl-treated mice were cocultured with CD4+ T cells and CD19+ B cells isolated from the SLE mice, and stimulated with ALD-DNA for 6 days. Anti-dsDNA IgG levels in the culture supernatants were evaluated by ELISA. Data are mean ± S.E. of three independent experiments, n = 4. ***, p < 0.001.
FIGURE 9.
FIGURE 9.
Knockdown of DAI in vivo alleviates SLE syndrome accompanied with blunted renal macrophage activation and decreased inflammatory response in lupus mice. ALD-DNA-immunized lupus mice were treated with siDAI or siControl. PBS- and UnALD-DNA-immunized mice were used as controls. A, real-time PCR analysis of the DAI mRNA level in renal macrophages purified from siDAI-treated lupus mice or siControl-treated lupus mice at week 12 after initial immunization. B, at week 12 after initial immunization, mRNA levels of TNF-α, IL-6, IL-10, and MCP-1 in the renal macrophages purified from the mice were evaluated by real-time PCR. C, at week 12 after the initial immunization, the purified renal macrophages from the siDAI-treated or siControl-treated lupus mice were cocultured with CD4+ T cells and CD19+ B cells from the SLE mice, then stimulated with ALD-DNA for 6 days. Levels of anti-dsDNA IgG in the culture supernatants were analyzed by ELISA. D, at week 12, levels of TNF-α, IL-6, IL-10, and MCP-1 in serum of the mice were determined by ELISA. E, at week 12, kidney tissue was collected and homogenized, the expressions of TNF-α, IL-6, IL-10, and MCP-1 were determined by ELISA. F, serum anti-dsDNA Ab level every 2 weeks were measured by ELISA. G, urine protein levels of mice were assessed by the BCA Protein Assay kit. Data in A-G are mean ± S.E. of three independent experiments, n = 8. H, 12 weeks after the initial immunization, glomerular immune deposition was detected by direct immunofluorescence for IgG in frozen kidney section of mice. Representative images (magnification ×200) of 10 mice are shown for each group. I, mean glomerular fluorescence intensity (arbitrary units) was determined for IgG in siDAI-treated lupus mice and siControl-treated lupus mice at week 12 after the initial immunization, n = 10. **, p < 0.01. J, 12 weeks after initial immunization, nephritic pathology was evaluated by H&E staining of renal tissues. Images (magnification ×200) are representative of at least 10 mice in each group. K, the kidney score was assessed using paraffin sections stained with H&E in J. ***, p < 0.001.
FIGURE 10.
FIGURE 10.
Adoptive transfer of macrophages stably expressing shDAI alleviates lupus nephritis. Macrophages stably expressing shDAI (shDAI Mϕ) were retrieved and 2.5 × 10⁶ injected (i.v.) into mice at weeks 0, 2, and 4 after the initial ALD-DNA immunization. Mice injected with macrophages expressing shControl (shControl Mϕ) were used as control. A, real-time PCR analysis of the DAI mRNA level in renal macrophages purified from shDAI macrophage-treated lupus mice or shControl macrophage-treated lupus mice at week 12 after the initial immunization. B, the renal macrophages purified from lupus mice adoptively transferred with shDAI-macrophages were infected with 0.1 μg of pNF-κB-Luc or pIRF3-Luc for 36 h. The cells were stimulated with ALD-DNA (1 μg/ml), UnALD-DNA (1 μg/ml), or PBS for another 12 h. Luciferase activities were measured and normalized to Renilla luciferase activities. C, at week 12 after the initial immunization, mRNA levels of TNF-α, IL-6, IL-10, and MCP-1 in the renal macrophages purified from shDAI macrophage-treated lupus mice or shControl macrophage-treated lupus mice were evaluated by real-time PCR. D, at week 12 after the initial immunization, the purified renal macrophages from the shDAI macrophage-treated lupus mice or shControl macrophage-treated lupus mice were cocultured with CD4+ T cells and CD19+ B cells from the SLE mice, then stimulated with ALD-DNA for 6 days. Levels of anti-dsDNA IgG in the culture supernatants were analyzed by ELISA. E, at week 12, levels of TNF-α, IL-6, IL-10, and MCP-1 in serum of the mice were determined by ELISA. F, at week 12, kidney tissues were collected and homogenized, the expression of TNF-α, IL-6, IL-10, and MCP-1 were determined by ELISA. G, serum anti-dsDNA Ab level every 2 weeks were measured by ELISA. H, urine protein levels of mice were assessed by the BCA Protein Assay kit. Data in A-H are mean ± S.E. of three independent experiments, n = 8. I, 12 weeks after the initial immunization, glomerular immune deposition was detected by direct immunofluorescence for IgG in frozen kidney sections of mice. Representative images (magnification ×200) of 10 mice are shown for each group. J, mean glomerular fluorescence intensity (arbitrary units) was determined for IgG in shDAI macrophage-treated lupus mice or shControl macrophage-treated lupus mice at week 12 after the initial immunization, n = 10. **, p < 0.01. K, 12 weeks after the initial immunization, nephritic pathology was evaluated by H&E staining of renal tissues. Images (magnification ×200) are representative of at least 10 mice in each group. L, the kidney score was assessed using paraffin sections stained with H&E in J. ***, p < 0.001.

Similar articles

Cited by

References

    1. Okabe Y., Kawane K., Akira S., Taniguchi T., Nagata S. (2005) Toll-like receptor-independent gene induction program activated by mammalian DNA escaped from apoptotic DNA degradation. J. Exp. Med. 202, 1333–1339 - PMC - PubMed
    1. Casciola-Rosen L. A., Anhalt G., Rosen A. (1994) Autoantigens targeted in systemic lupus erythematosus are clustered in two populations of surface structures on apoptotic keratinocytes. J. Exp. Med. 179, 1317–1330 - PMC - PubMed
    1. Mevorach D., Zhou J. L., Song X., Elkon K. B. (1998) Systemic exposure to irradiated apoptotic cells induces autoantibody production. J. Exp. Med. 188, 387–392 - PMC - PubMed
    1. Savill J., Dransfield I., Gregory C., Haslett C. (2002) A blast from the past. Clearance of apoptotic cells regulates immune responses. Nat. Rev. Immunol. 2, 965–975 - PubMed
    1. Wen Z. K., Xu W., Xu L., Cao Q. H., Wang Y., Chu Y. W., Xiong S. D. (2007) DNA hypomethylation is crucial for apoptotic DNA to induce systemic lupus erythematosus-like autoimmune disease in SLE-non-susceptible mice. Rheumatology 46, 1796–1803 - PubMed

Publication types

MeSH terms