. 2013 May 17;288(20):14476-14487.
doi: 10.1074/jbc.M113.459222. Epub 2013 Apr 3.

Hemolymph melanization in the silkmoth Bombyx mori involves formation of a high molecular mass complex that metabolizes tyrosine

Affiliations

Hemolymph melanization in the silkmoth Bombyx mori involves formation of a high molecular mass complex that metabolizes tyrosine

Kevin D Clark et al. J Biol Chem. .

Abstract

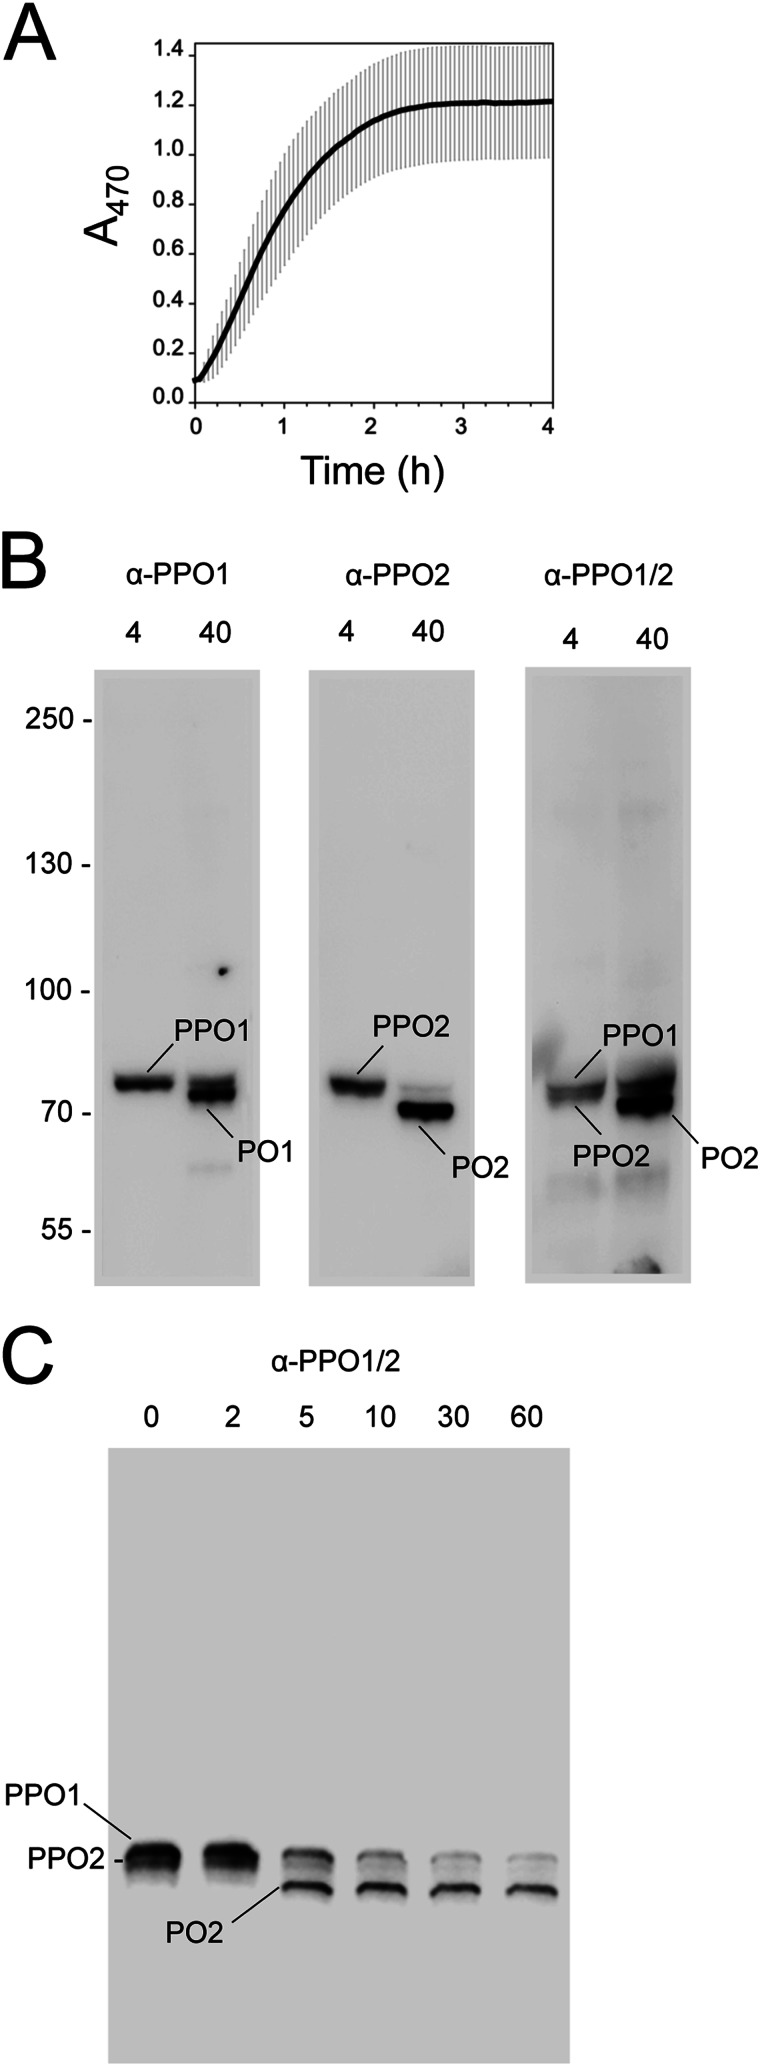
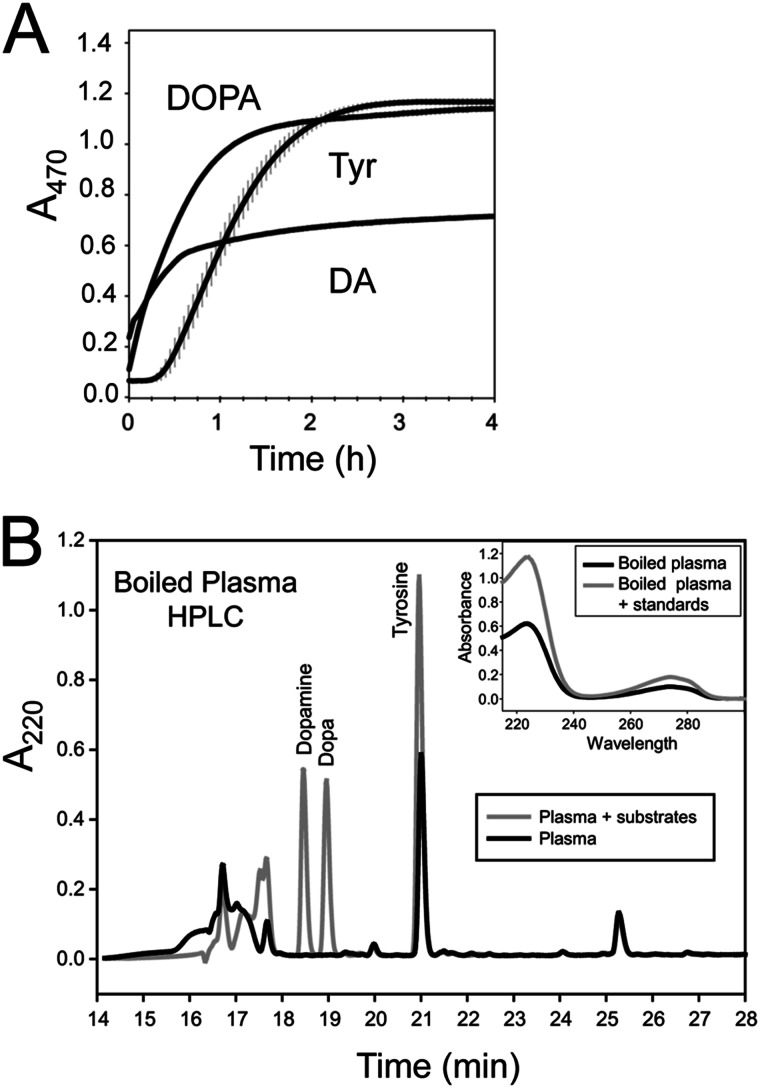
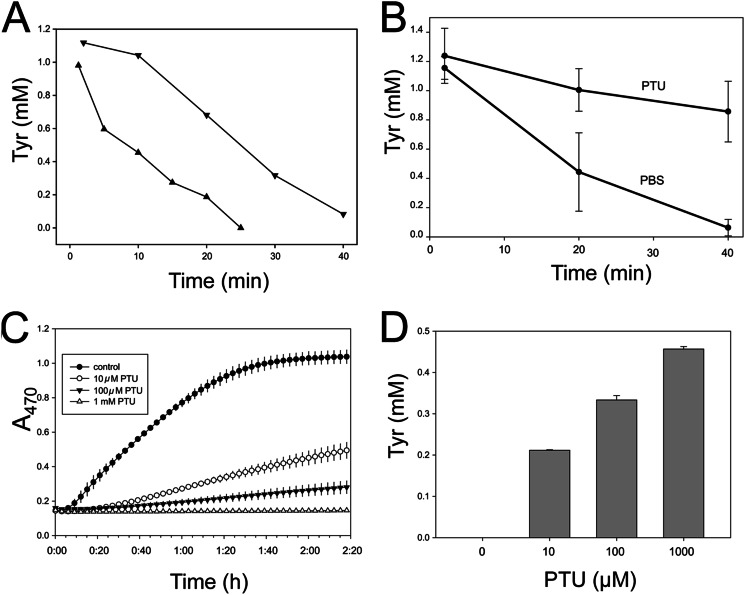
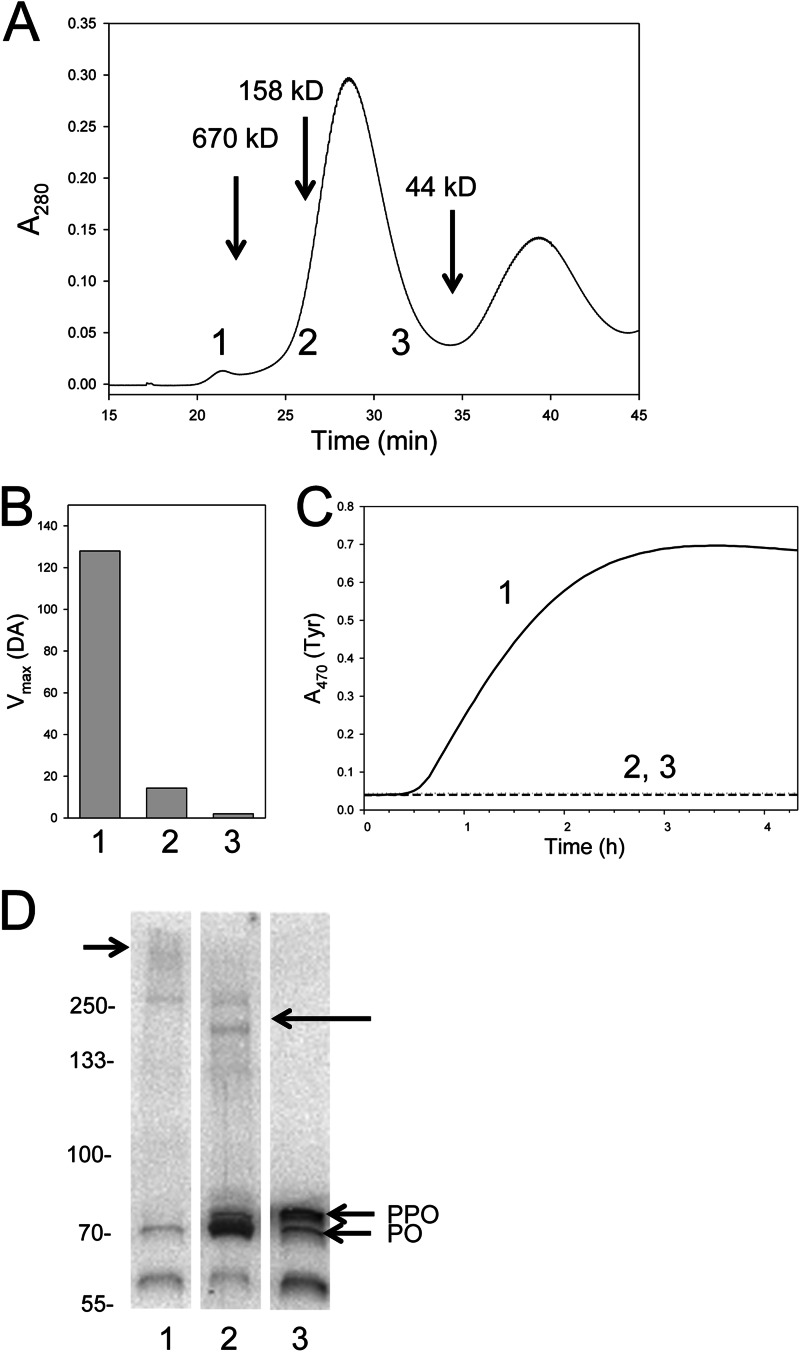
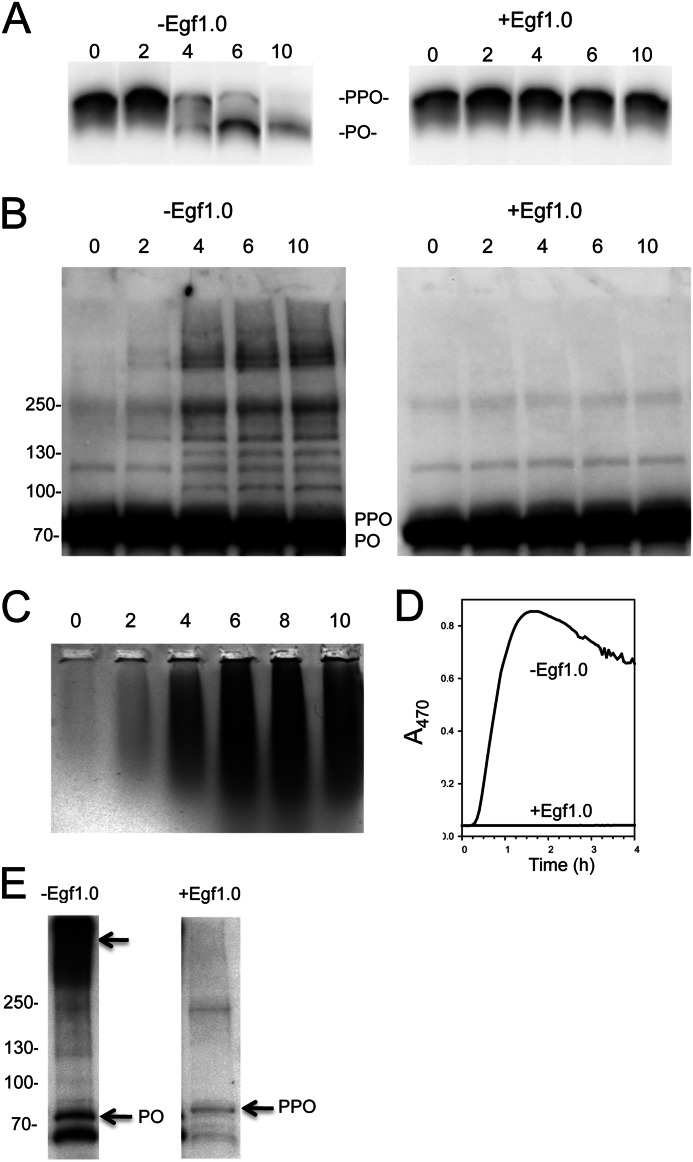
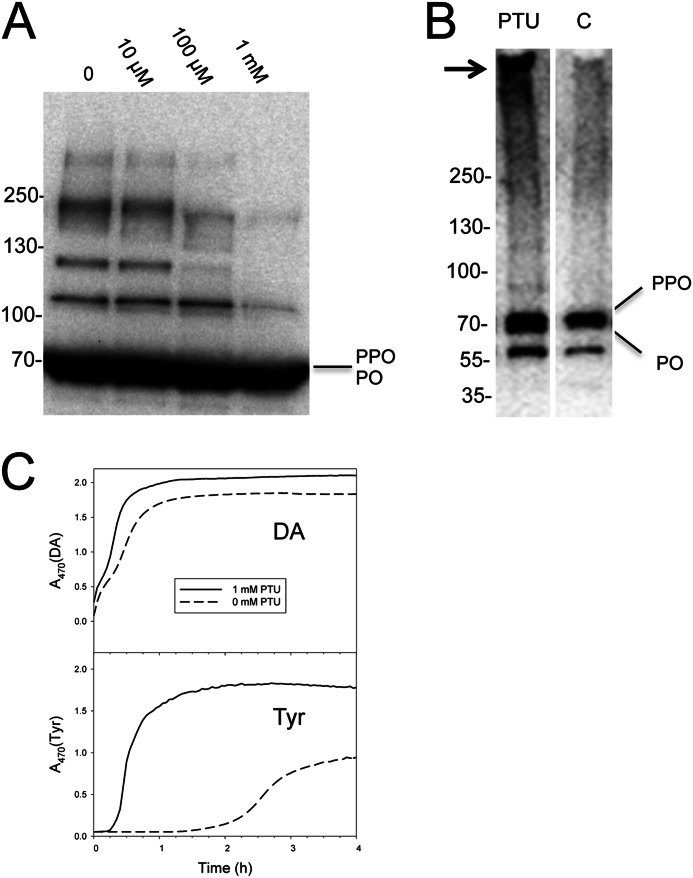
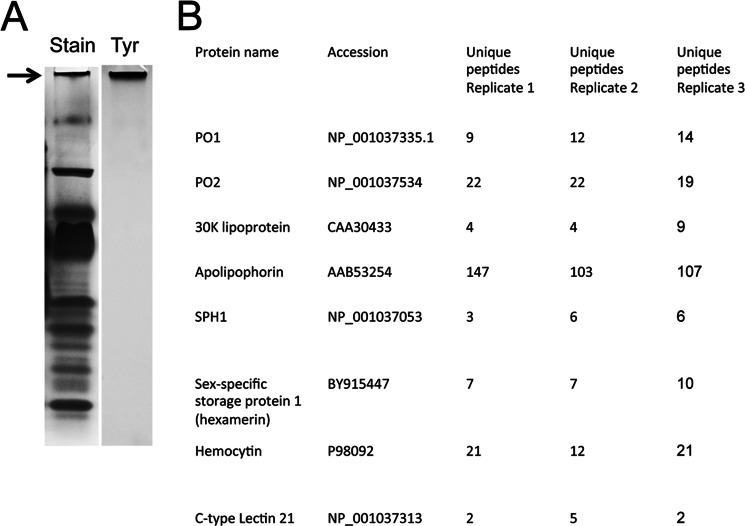
The phenoloxidase (PO) cascade regulates the melanization of blood (hemolymph) in insects and other arthropods. Most studies indicate that microbial elicitors activate the PO cascade, which results in processing of the zymogen PPO to PO. PO is then thought to oxidize tyrosine and o-diphenols to quinones, which leads to melanin. However, different lines of investigation raise questions as to whether these views are fully correct. Here we report that hemolymph from the silkmoth, Bombyx mori, rapidly melanizes after collection from a wound site. Prior studies indicated that in vitro activated PPO hydroxylates Tyr inefficiently. Measurement of in vivo substrate titers, however, suggested that Tyr was the only PO substrate initially present in B. mori plasma and that it is rapidly metabolized by PO. Fractionation of plasma by gel filtration chromatography followed by bioassays indicated that melanization activity was primarily associated with a high mass complex (~670 kDa) that contained PO. The prophenoloxidase-activating protease inhibitor Egf1.0 blocked formation of this complex and Tyr metabolism, but the addition of phenylthiourea to plasma before fractionation enhanced complex formation and Tyr metabolism. Mass spectrometry analysis indicated that the complex contained PO plus other proteins. Taken together, our results indicate that wounding alone activates the PO cascade in B. mori. They also suggest that complex formation is required for efficient use of Tyr as a substrate.

Keywords: Amino Acid; Blood; Cascade; Insect Immunity; Melanin; Phenoloxidase; Protease; Wound Healing.


Figures

FIGURE 1.
FIGURE 1.
The PO cascade in B. mori is activated by wounding. A, melanization rate of B. mori plasma. Freshly prepared plasma from three fifth instar larvae (20 μl each) was diluted in PBS (80 μl), plated, and monitored for melanization activity 0–4 h ± S.D. post-collection from a wound site. Activity was measured by monitoring formation of dopachrome or dopaminechrome (melanization intermediates) at A470. B, plasma was collected as outlined in A, followed by the addition of sample buffer at 4 or 40 min. After separation on 7.5% continuous SDS-polyacrylamide gels under reducing conditions, samples were immunoblotted using antibodies for PPO1 (α-PPO1), PPO2 (α-PPO2), or a cross-reacting antibody that recognizes both PPOs (α-PPO1/2). Bands corresponding to the predicted sizes of PPO1/PO1 and PPO2/PO2 are indicated. Note that the affinity of α-PPO1/2 for PO2 is stronger than for PO1. C, immunoblot prepared as described in B but with sample buffer added at 0–60 min post-collection and probed using α-PPO1/2. Bands corresponding to PPO1/PO1 and PPO2/PO2 are indicated. Molecular mass markers in B are indicated on the left.
FIGURE 2.
FIGURE 2.
SFP uses multiple substrates but newly collected plasma contains only Tyr. A, melanization rate of SFP. Plasma was prepared in GSH (5 mm final) to block melanization and then washed three times on a 30-kDa filter to prepare SFP. SFP (20 μl) was diluted in PBS (80 μl) along with substrate (0.5 mm final) and monitored for melanin formation at A470. B, fractionation of substrates in plasma by HPLC. Plasma from a fifth instar was boiled for 1 min, cooled on ice, and centrifuged to remove precipitate, and the supernatant was separated by HPLC. The dark line indicates the timing of when peaks from plasma eluted, whereas the light line indicates the timing when peaks corresponding to the tyrosine, DOPA, and dopamine standards eluted. Collected fractions (0.5 ml) were lyophilized, resuspended in PBS, and tested for melanizing activity using B. mori SFP. The active fraction at 21 min co-eluted with a tyrosine standard. The tyramine standard also eluted at 21 min (not shown; see “Results”). Inset, absorbance spectrum of the 21 min peak with and without a co-injected tyrosine standard.
FIGURE 3.
FIGURE 3.
PTU inhibits the rapid metabolism of tyrosine in plasma. A, tyrosine decay in plasma from two different larvae. Aliquots of plasma were removed at the indicated time points, diluted 1:3 with H2O (0.05% TFA), and boiled for 45 s. Protein precipitates were removed by centrifugation, and the supernatants were separated by HPLC as described above. Tyr concentrations were determined by injected standards. B, effect of PTU on Tyr metabolism in plasma. C, effect of PTU on melanization of Tyr by SFP. Tyr was added to SFP at a final concentration of 0.5 mm along with the indicated concentrations of PTU and immediately monitored for melanin formation at A470. D, effect of PTU on Tyr metabolism in SFP. Samples were collected after 2 h, 20 min, filtered (30 kDa) to remove protein and melanin, and then separated by HPLC to measure Tyr as described. Error bars, S.E.
FIGURE 4.
FIGURE 4.
Tyr-dependent melanization in B. mori is associated with a high molecular mass fraction. A, plasma was separated by Sephacryl S-300 HR chromatography. Protein eluent was measured at A280 from the void volume of the column to 45 min. The elution times for the 670-, 158-, and 44-kDa protein standards eluted are indicated. Fractions (0.7 ml) were collected from 17 min (void volume of the column) to 45 min and assayed using DA or Tyr as the substrate. Three of these fractions (numbered 1, 2, and 3) are indicated at the bottom of the chromatogram. B, melanization activity for fractions 1, 2, and 3 using DA as the substrate. Substrate was added to the fraction at a final concentration of 0.5 mm, followed by monitoring of dopachrome or dopaminechrome at A470. Vmax values (milli-optical density/min) are presented because kinetics were linear. C, melanization activity for fractions 1–3 using Tyr as the substrate was measured in the same manner as for DA, but results are plotted as a time course. Note that melanization rates are lower than for whole plasma because of sample dilution. D, the proteins in fractions 1–3 were separated on a 4–20% SDS-polyacrylamide gel under reducing conditions, followed by immunoblotting using α-PPO1/2. Bands corresponding to monomeric PPO and PO are indicated. The ∼60 kDa band recognized by α-PPO1/2 corresponds to the predicted mass of PO cleaved at a second Arg-Phe site that exists downstream of the site normally associated with processing of PPO to PO. A short arrow (left) points to a diffuse high mass band recognized by α-PPO1/2 in fraction 1. A long arrow (right) points to two higher molecular mass bands that run between the 250 and 133 kDa markers that was recognized by α-PPO1/2 in fraction 2. Molecular mass markers are indicated on the left.
FIGURE 5.
FIGURE 5.
Egf1.0 inhibits Tyr-dependent melanization and formation of high mass complexes. A, Egf1.0 blocks PPO cleavage. Aliquots of B. mori plasma were collected and processed 0, 2, 4, 6, or 10 min later. Samples were then separated on a 7.5% continuous SDS-polyacrylamide gel, followed by immunoblotting using α-PPO1/2 as outlined in Fig. 4. B, Egf1.0 blocks formation of most PO-containing complexes that form in plasma. The same samples from A were separated on a 4–20% gradient SDS-polyacrylamide gel using an 8-fold higher sample load. Overloading resulted in no resolution of PPO from PO. The left blot shows the appearance of many PO-containing high mass bands in samples without Egf1.0, whereas the right blot shows that few high mass bands form in samples with Egf1.0. C, Egf1.0 blocks Tyr-dependent melanization. Egf1.0 was added to freshly prepared plasma at 0–10 min post-collection. At 10 min, samples (15 μl) were mixed with 4× native PAGE sample buffer (5 μl; Invitrogen), loaded onto a 0.33% SeaKem agarose gel and run for 2 h at 40 V in Tris-EDTA buffer. Melanization activity was assayed by immersing the gel in 0.5 mm Tyr in PBS for 1 h. D, Egf1.0 blocks melanization activity in fraction 1 using Tyr as the substrate. Freshly prepared B. mori plasma with and without Egf1.0 was separated by Superdex 200 chromatography, and protein eluent was measured at A280. Fraction 1 (0.7 ml), as described in the legend to Fig. 4, was collected and assayed for melanin formation at A470 after the addition of Tyr (0.5 mm). E, the same samples from D were concentrated 10-fold on 30-kDa filters (Amicon Ultra 0.5 ml 30k Ultracel), run on a 4–20% gradient SDS-polyacrylamide gel, and immunoblotted with α-PPO1/2. The PO-containing high mass band was readily visible in fraction 1 from plasma without Egf1.0 (arrow) but was absent in fraction 1 from plasma with Egf1.0. Monomeric PPO and PO are indicated to the right of each lane, whereas molecular mass markers are indicated to the left.
FIGURE 6.
FIGURE 6.
Collection of plasma in PTU enhances formation of the high mass complex in fraction 1. A, PTU blocks formation of most PO-containing complexes in plasma. PTU (10 μm to 1 mm) was added to newly collected plasma and then subjected to SDS-PAGE and immunoblot analysis as described in the legend to Fig. 5B. Numerous PO-containing high mass bands are visible in the plasma sample with no PTU, whereas most of these bands are absent in the sample with 1 mm PTU. B, plasma prepared with and without PTU (1 mm) was separated by gel filtration chromatography as outlined in the legend to Fig. 4. Fraction 1 was then added to a 4–20% SDS-polyacrylamide gel under reducing conditions, followed by immunoblotting using α-PPO1/2. The PO-containing high mass complex (arrow) is clearly more visible in fraction 1 from plasma where PTU was added than in fraction 1 from plasma without PTU. In contrast, the abundance of monomeric PPO and PO is similar. Mass markers are indicated to the left. C, melanization activity of fraction 1 from plasma samples with or without PTU (1 mm) using DA or Tyr as the substrate at a final concentration of 0.5 mm. Melanization activity was measured by monitoring dopachrome or dopaminechrome formation at A470.
FIGURE 7.
FIGURE 7.
B. mori proteins detected in the high mass complex by Orbitrap mass spectrometry. A, aliquots of freshly prepared plasma were collected in PTU (200 μm final concentration). After 1 h, samples (15 μl) were mixed with 4× native PAGE sample buffer (5 μl; Invitrogen) and run on 4–20% native PAGE. The lane to the left was stained with Coomassie Blue, whereas the lane to the right was immersed in 0.5 mm Tyr in PBS for 1 h. The only band that exhibited any melanization was a high mass entity that corresponded to fraction 1 from our gel filtration analysis. B, this band was excised from three independently prepared samples and subjected to Orbitrap MS analysis. The names and GenBankTM accession numbers for the proteins identified in the band are listed to the left. The number of unique peptides corresponding to each of these proteins from each replicate is indicated to the right.

Similar articles

Cited by

References

    1. Cerenius L., Lee B. L., Söderhäll K. (2008) The proPO-system. Pros and cons for its role in invertebrate immunity. Trends Immunol. 29, 263–271 - PubMed
    1. Kanost M. R., Gorman M. J. (2008) Phenoloxidases in insect immunity. in Insect Immunology (Beckage N. E., ed) pp. 69–96, Academic Press, Inc., San Diego
    1. Nappi A., Poirié M., Carton Y. (2009) The role of melanization and cytotoxic by-products in the cellular immune responses of Drosophila against parasitic wasps. in Advances in Parasitology (Genevieve P., ed) pp. 99–121, Academic Press, Inc., San Diego - PubMed
    1. Sugumaran M. (2002) Comparative biochemistry of eumelanogenesis and the protective roles of phenoloxidase and melanin in insects. Pigment Cell Res. 15, 2–9 - PubMed
    1. Cerenius L., Söderhäll K. (2004) The prophenoloxidase-activating system in invertebrates. Immunol. Rev. 198, 116–126 - PubMed

Publication types

LinkOut - more resources