. 2013 May 10;288(19):13831-41.
doi: 10.1074/jbc.M112.441055. Epub 2013 Apr 3.

Enhanced asynchronous Ca(2+) oscillations associated with impaired glutamate transport in cortical astrocytes expressing Fmr1 gene premutation expansion

Affiliations

Enhanced asynchronous Ca(2+) oscillations associated with impaired glutamate transport in cortical astrocytes expressing Fmr1 gene premutation expansion

Zhengyu Cao et al. J Biol Chem. .

Abstract

Background: FMR1 CGG expansion repeats in the premutation range have not been linked to astrocyte pathophysiology.

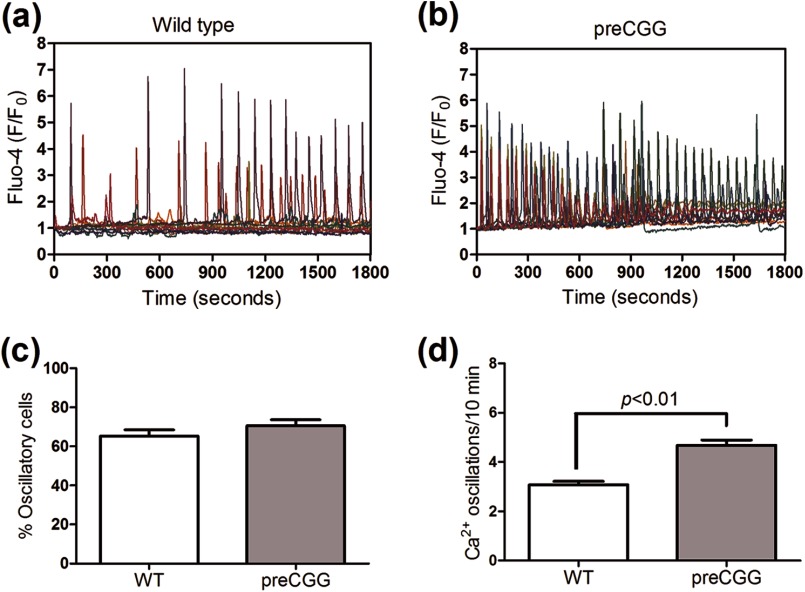
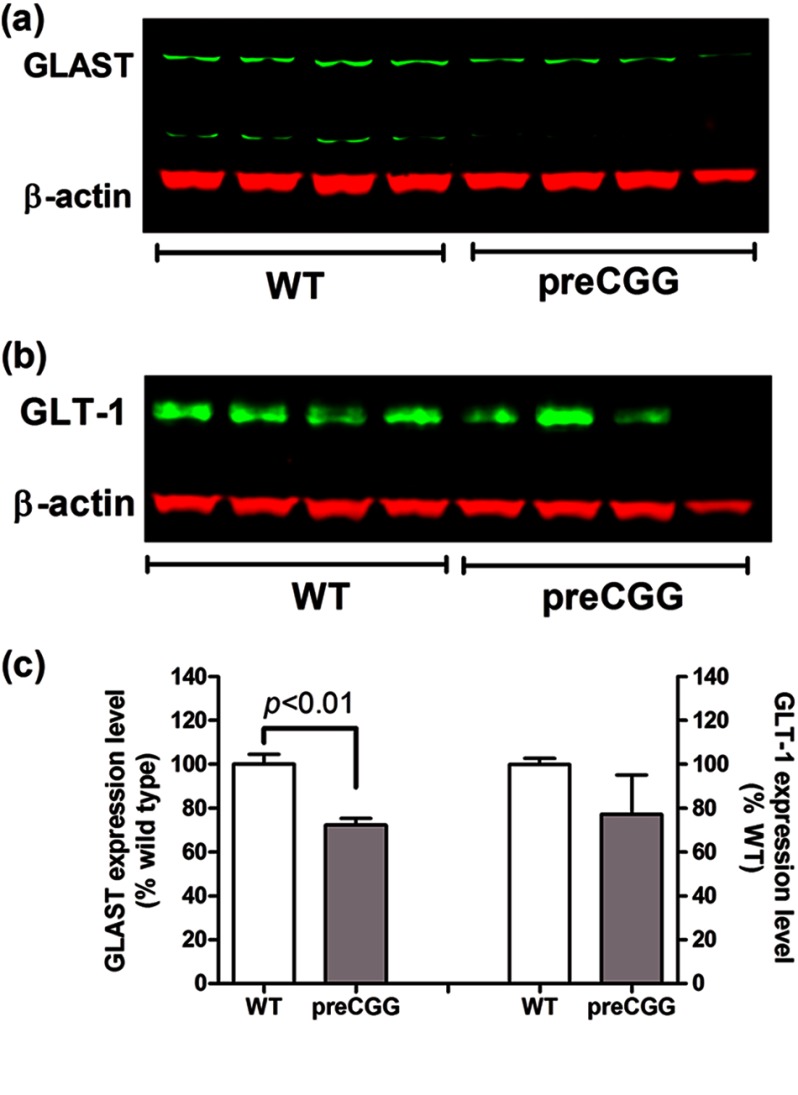
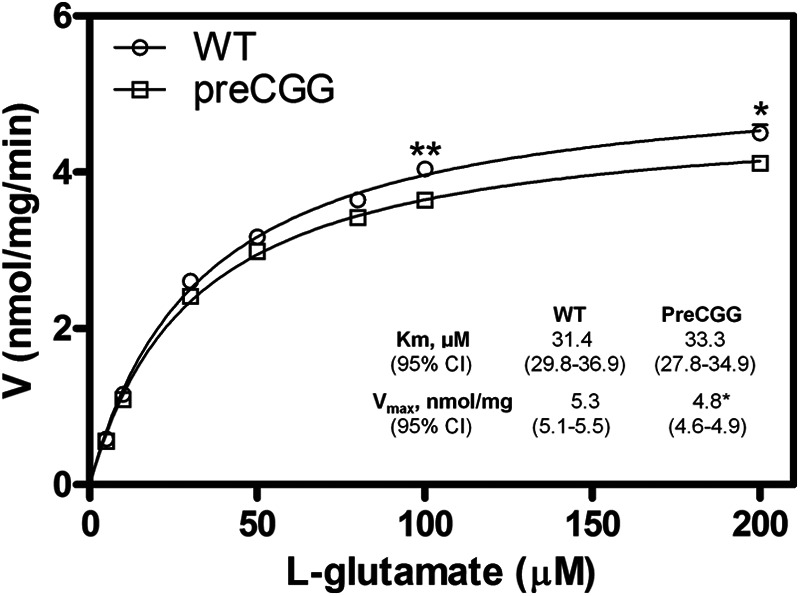
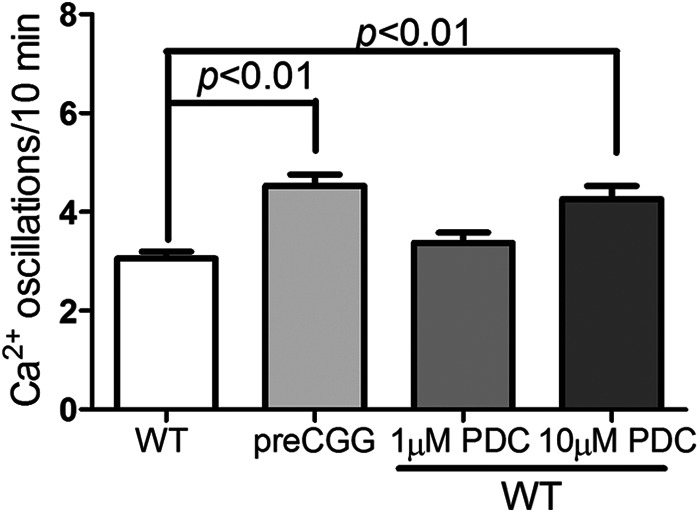
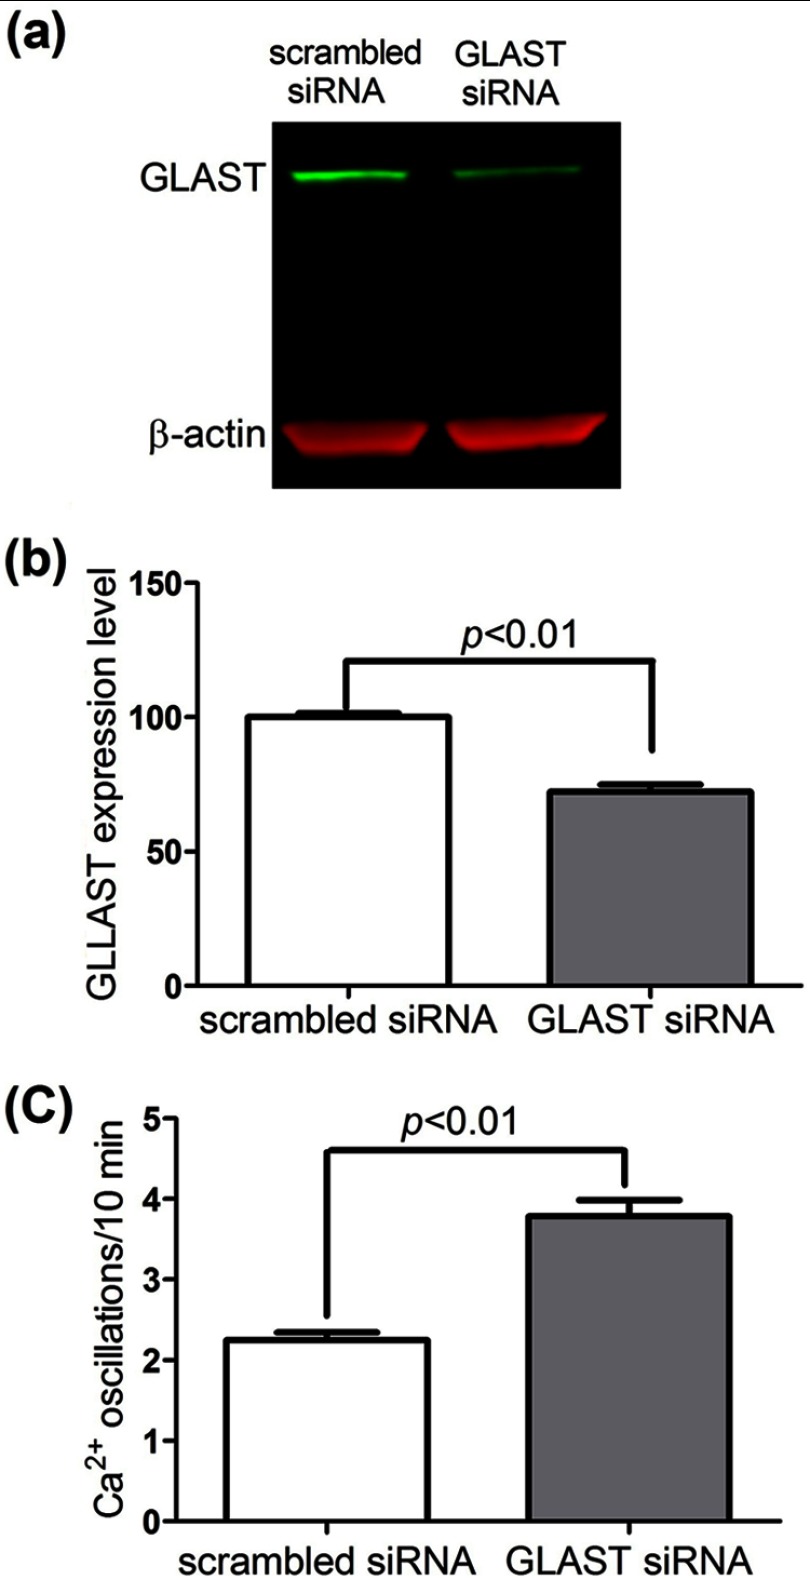
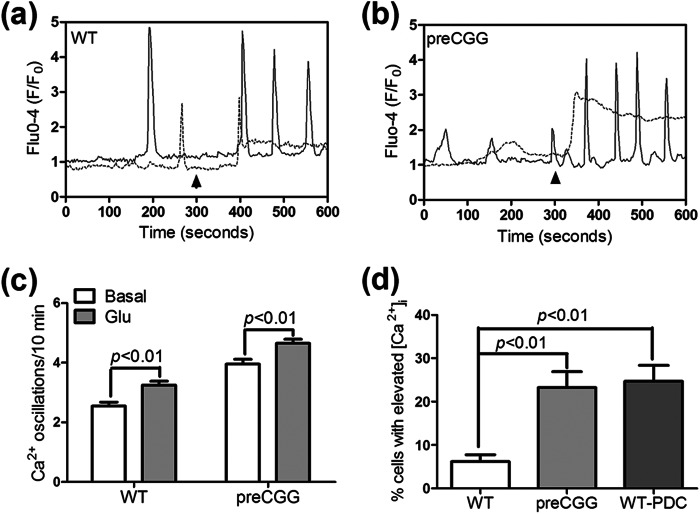
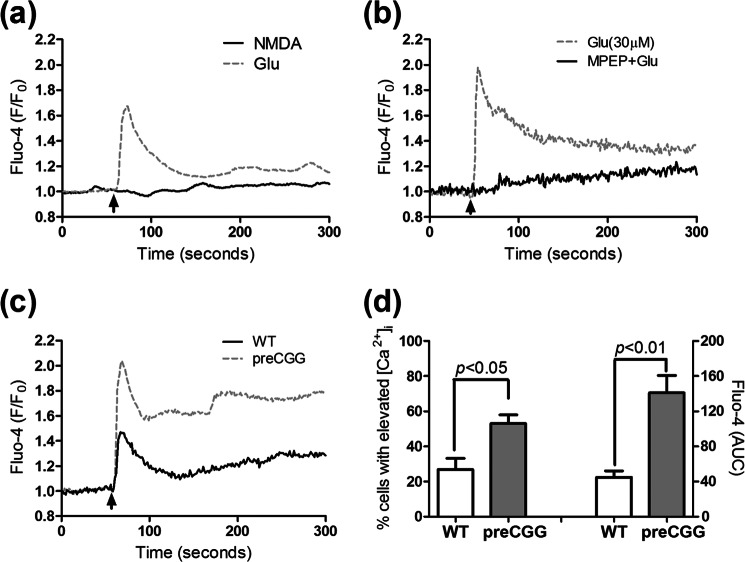
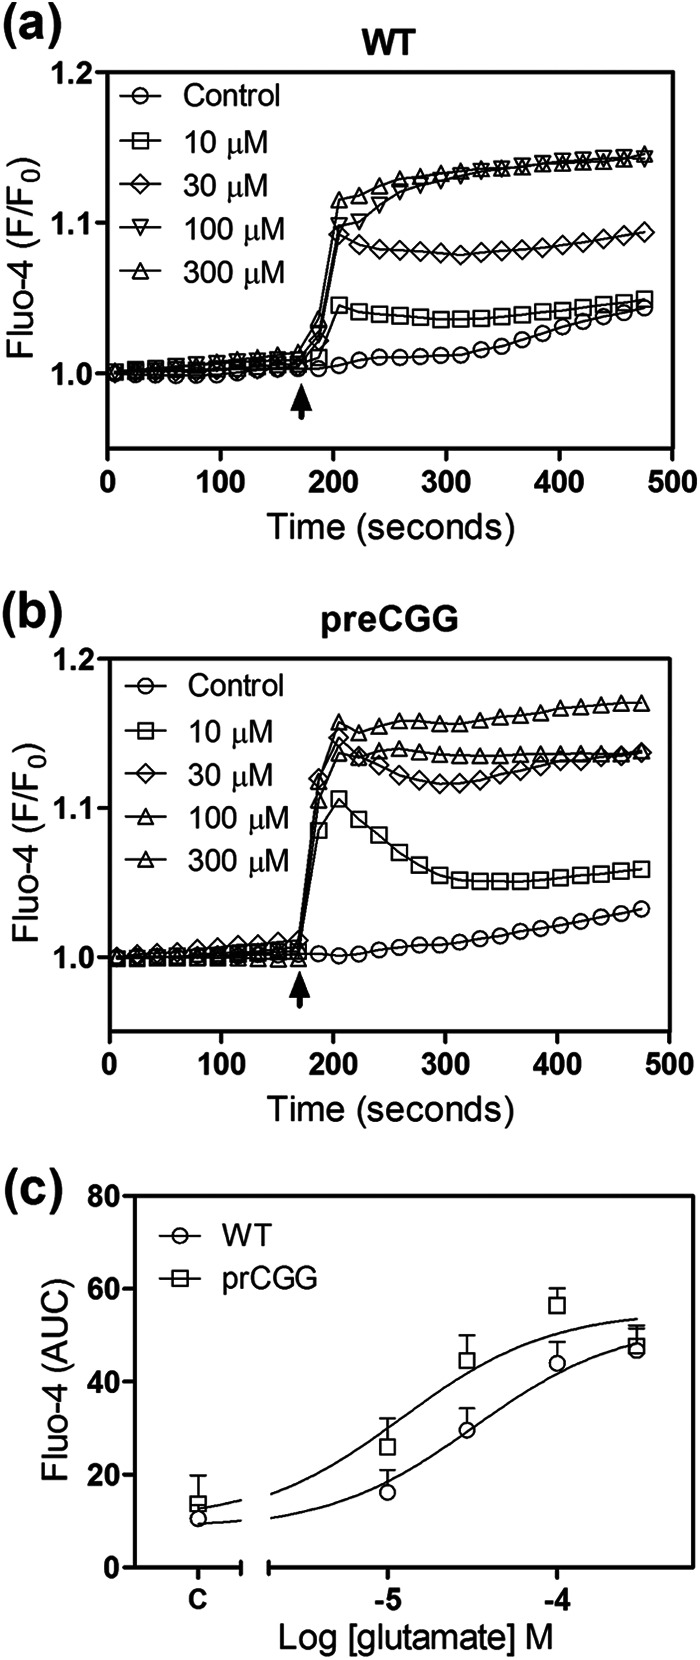
Results: Premutation cortical astrocytes display decreased Glu transporter expression/activity and enhanced asynchronous Ca(2+) oscillations.

Conclusion: Glu transport and Ca(2+) signaling defects in premutation astrocytes could contribute to FXTAS neuropathology.

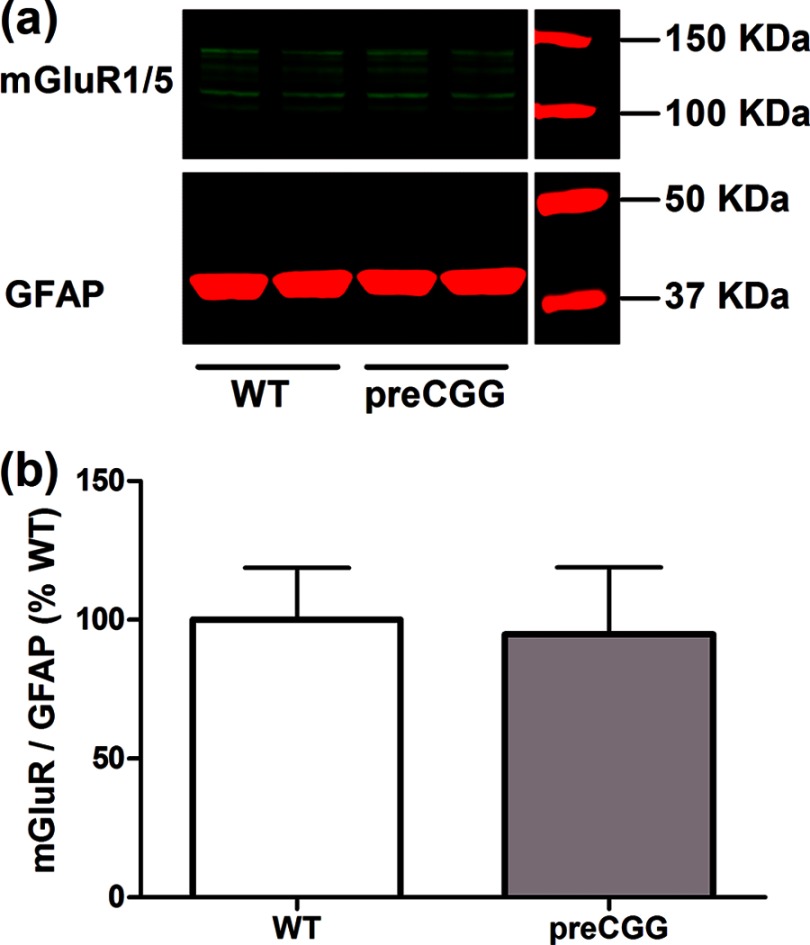
Significance: Premutation astrocytes may have an etiological role in FXTAS neuropathology. Premutation CGG repeat expansions (55-200 CGG repeats; preCGG) within the fragile X mental retardation 1 (FMR1) gene can cause fragile X-associated tremor/ataxia syndrome. Defects in early neuronal migration and morphology, electrophysiological activity, and mitochondria trafficking have been described in a premutation mouse model, but whether preCGG mutations also affect astrocyte function remains unknown. PreCGG cortical astrocytes (∼170 CGG repeats) displayed 3-fold higher Fmr1 mRNA and 30% lower FMR1 protein (FMRP) when compared with WT. PreCGG astrocytes showed modest reductions in expression of glutamate (Glu) transporters GLT-1 and GLAST and attenuated Glu uptake (p < 0.01). Consistent with astrocyte cultures in vitro, aged preCGG mice cerebral cortex also displayed reduced GLAST and GLT-1 expression. Approximately 65% of the WT and preCGG cortical astrocytes displayed spontaneous asynchronous Ca(2+) oscillations. PreCGG astrocytes exhibited nearly 50% higher frequency of asynchronous Ca(2+) oscillations (p < 0.01) than WT, a difference mimicked by chronic exposure of WT astrocytes to l-trans-pyrrolidine-2,4-dicarboxylic acid (l-trans-PDC) or by partial suppression of GLAST using siRNA interference. Acute challenge with Glu augmented the frequency of Ca(2+) oscillations in both genotypes. Additionally, 10 μm Glu elicited a sustained intracellular Ca(2+) rise in a higher portion of preCGG astrocytes when compared with WT. Pharmacological studies showed that mGluR5, but not NMDA receptor, contributed to Glu hypersensitivity in preCGG astrocytes. These functional defects in preCGG astrocytes, especially in Glu signaling, may contribute to fragile X-associated tremor/ataxia syndrome neuropathology.

Keywords: Astrocytes; Ca2+ Oscillation; Calcium; FXTAS; Glutamate Transporter; Neurodegenerative Diseases; Neurological Diseases; Neurotransmitter Transport; Premutation CGG Expansion.


Figures

FIGURE 1.
FIGURE 1.
Representative GFAP immunocytochemistry of astrocytes cultured from WT mice and knock-in FMR1 premutation (preCGG) mice. WT and preCGG cortical astrocytes exhibit similar morphology when stained with GFAP. Nearly all the cells were GFAP-positive in both WT and preCGG cortical astrocyte culture, indicating a high enrichment of astrocytes in our culture.
FIGURE 2.
FIGURE 2.
PreCGG cortical astrocytes display higher Fmr1 mRNA level and reduced FMRP proteins when compared with WT controls. a, Fmr1 mRNA level comparison between WT and preCGG astrocytes. Quantitative RT-PCR was performed, and Fmr1 mRNA level was measured. PreCGG astrocytes showed 311 ± 50% (mean ± S.E.) of the WT control (p < 0.01, n = 6). b, representative Western blotting for FMRP expression in WT and preCGG cortical astrocytes. c, quantification of FMRP expression in WT and preCGG cortical cultures. PreCGG cortical astrocytes displayed 70.1 ± 7.2% of WT control (p < 0.01, n = 4).
FIGURE 3.
FIGURE 3.
PreCGG mutation mouse cortical astrocytes display more spontaneous Ca2+ oscillations. a and b, representative ten Ca2+ traces in WT (a) and preCGG (b) cortical astrocytes, respectively. Data are presented as F/F0. c, quantification of the percentage of oscillatory cells in WT and preCGG cortical astrocytes. The percentages of oscillatory astrocytes were 65.3 ± 3.3% (n = 20 wells) in preCGG cortical astrocytes and 70.6 ± 3.0% (n = 16 wells, p > 0.05) in WT controls. d, quantification of Ca2+ oscillation frequency in WT and preCGG oscillatory cortical astrocytes. PreCGG cortical astrocytes displayed more Ca2+ oscillations (4.68 ± 0.21/10 min, n = 431 cells) than WT control (3.15 ± 0.14/10 min, p < 0.01, n = 450 cells).
FIGURE 4.
FIGURE 4.
PreCGG cortical astrocytes display lower expression of Glu transporters, GLT-1 and GLAST. a and b, representative Western blotting for GLAST (a) and GLT-1 (b) in WT and preCGG cortical astrocytes. The representative bands were from two independent paired cultures. c, quantification of GLAST and GLT-1 expression in WT and preCGG cortical astrocyte cultures, respectively. The expression for GLAST and GLT-1 was 88.6 ± 2.4% (p < 0.05, n = 4) and 92.1 ± 1.8% (p < 0.01, n = 6) of WT controls, respectively. These data were from at least three independent paired cultures.
FIGURE 5.
FIGURE 5.
Reduced expression of Glu transporters, GLAST and GLT-1, in preCGG mouse cortex. a and b, representative Western blots for GLAST (a) and GLT-1 (b) in WT and preCGG brain cortex. Each genotype had four mice with an age range of 46–59 weeks (p > 0.05). c, quantification of GLAST and GLT-1 expression in WT and preCGG mice brain cortex, respectively. The expression for GLAST and GLT-1 was 72.3 ± 3.1% (p < 0.01, n = 4) and 77.2 ± 17.8% (p > 0.05, n = 4) of WT controls, respectively.
FIGURE 6.
FIGURE 6.
PreCGG astrocytes display decreased Glu uptake. Kinetic analysis for Glu uptake in WT and preCGG cortical astrocytes was performed. Each data point represents mean ± S.E. (n = 12) from four independent cultures performed in triplicates. Uptake as a function of Glu concentration was fitted by the Michaelis-Menten equation. The Km values for Glu uptake were similar between WT and preCGG cortical astrocytes. However, preCGG cortical astrocytes displayed reduced Vmax for Glu uptake, which was 5.29 (5.10–5.47 nmol/mg of protein/min, 95% CI) in WT cortical astrocytes and 4.79 (4.62–4.97 nmol/mg of protein/min, 95% CI) in preCGG cortical astrocytes. *, p < 0.05, **, p < 0.01.
FIGURE 7.
FIGURE 7.
Chronic exposure to low concentrations of l-trans-PDC enhances the spontaneous Ca2+ oscillations in WT cortical astrocytes. WT cortical astrocytes chronically exposed to 10 μm l-trans-PDC displayed significantly increased Ca2+ oscillations when compared with vehicle-treated WT astrocytes. Each data point represents mean ± S.E. with at least 90 cells from two independent cultures.
FIGURE 8.
FIGURE 8.
Suppression of GLAST expression enhances the spontaneous Ca2+ oscillations in WT cortical astrocytes. WT cortical astrocytes were transfected with scrambled or GLAST siRNA. a, representative Western blot for GLAST expression after transfection with scrambled sequence or GLAST siRNA for 72 h. b, quantification of GLAST expression in the astrocytes transfected with scrambled sequence or GLAST siRNA. Transfection with GLAST siRNA decreased GLAST expression to 72.1 ± 2.8% (n = 8, p < 0.01) of the negative controls. c, astrocytes with GLAST siRNA transfection increased asynchronous spontaneous Ca2+ oscillations when compared with its negative control. Each data point represents mean ± S.E. with at least 160 cells from four independent cultures.
FIGURE 9.
FIGURE 9.
Influence of Glu on the Ca2+ dynamics in WT and preCGG cortical astrocytes. a and b, representative traces for Glu (10 μm) stimulation of Ca2+ response in WT (a) and preCGG (b) cortical astrocytes. Glu stimulated two distinct Ca2+ responses in both WT and preCGG cortical astrocytes. Some cells displayed more Ca2+ oscillations (solid trace), whereas the remaining responsive cells displayed sustained intracellular Ca2+ increase (dotted trace). Arrowheads indicate the addition of Glu (10 μm). c, quantification of the spontaneous Ca2+ oscillations before and after 10 μm Glu treatment. A concentration of 10 μm Glu increased the spontaneous Ca2+ oscillations in both WT and preCGG astrocytes. Each data point represents the mean ± S.E. from at least 150 cells for each group. d, quantification of the percentage of cells with sustained intracellular Ca2+ increase after treatment with 10 μm Glu in vehicle or 10 μm l-trans-PDC-exposed WT astrocytes and preCGG cortical astrocytes. Each data point represents the mean ± S.E. from at least 4 wells.
FIGURE 10.
FIGURE 10.
Influence of Glu receptor agonist or antagonist on the Ca2+ dynamics in WT or preCGG cortical astrocytes. a, lack of Ca2+ response of NMDA in preCGG cortical astrocytes (solid black line). Glu (30 μm) was used as a positive control (gray dotted line). b, An mGluR5 antagonist, MPEP (10 μm) suppressed the Glu (30 μm)-induced intracellular Ca2+ increase in preCGG cortical astrocytes. The astrocytes were incubated with MPEP for 10 min before the addition of Glu (arrowhead). These data were repeated twice in triplicates with similar results. c, representative traces of type I mGluR receptor agonist DHPG (2 μm)-induced intracellular Ca2+ increase in both WT and preCGG cortical astrocytes. Black solid trace, WT; gray dotted trace, preCGG. These data were repeated twice in duplicates with similar results. d, quantification of the percentage of cells with sustained intracellular Ca2+ increase as well as Ca2+ response (area under the curve, AUC) after WT and preCGG cortical astrocytes were exposed to 2 μm DHPG. These data were from two independent cultures in duplicates.
FIGURE 11.
FIGURE 11.
PreCGG cortical astrocytes are more sensitive to Glu exposure measured in a population level. a and b, Glu-induced Ca2+ response in WT (a) and preCGG (b) cortical astrocytes (error bars are omitted for clarity). c, concentration-response relationships for Glu-induced Ca2+ response (area under the curve, AUC) in WT and preCGG cortical astrocytes. Each data point represents mean ± S.E. (n = 8). The experiments were repeated three times, and the EC50 values were 35.23 ± 2.80 and 12.94 ± 3.89 μm (n = 3, p < 0.05) for Glu-induced Ca2+ response in WT and preCGG cortical astrocytes, respectively.
FIGURE 12.
FIGURE 12.
PreCGG cortical astrocytes display similar expression levels of mGluR1/5. a, representative Western blots for mGluR1/5 in WT and preCGG cortical astrocytes. b, quantification of mGluR1/5 expression in WT and preCGG cortical astrocyte cultures relative to GFAP. The expression levels for mGluR1/5 were similar to WT controls (n = 8 from four independent cultures, p > 0.05).

References

    1. Hagerman P. J. (2008) The fragile X prevalence paradox. J. Med. Genet. 45, 498–499 - PMC - PubMed
    1. Rodriguez-Revenga L., Madrigal I., Pagonabarraga J., Xunclà M., Badenas C., Kulisevsky J., Gomez B., Milà M. (2009) Penetrance of FMR1 premutation associated pathologies in fragile X syndrome families. Eur. J. Hum. Genet. 17, 1359–1362 - PMC - PubMed
    1. Goodlin-Jones B. L., Tassone F., Gane L. W., Hagerman R. J. (2004) Autistic spectrum disorder and the fragile X premutation. J. Dev. Behav. Pediatr. 25, 392–398 - PubMed
    1. Hessl D., Tassone F., Loesch D. Z., Berry-Kravis E., Leehey M. A., Gane L. W., Barbato I., Rice C., Gould E., Hall D. A., Grigsby J., Wegelin J. A., Harris S., Lewin F., Weinberg D., Hagerman P. J., Hagerman R. J. (2005) Abnormal elevation of FMR1 mRNA is associated with psychological symptoms in individuals with the fragile X premutation. Am. J. Med. Genet. B Neuropsychiatr. Genet. 139B, 115–121 - PubMed
    1. Farzin F., Perry H., Hessl D., Loesch D., Cohen J., Bacalman S., Gane L., Tassone F., Hagerman P., Hagerman R. (2006) Autism spectrum disorders and attention-deficit/hyperactivity disorder in boys with the fragile X premutation. J. Dev. Behav. Pediatr. 27, S137–S144 - PubMed

Publication types

MeSH terms

Supplementary concepts

LinkOut - more resources