

Ubiquitin E3 ligase Wwp1 negatively regulates osteoblast function by inhibiting osteoblast differentiation and migration
- PMID: 23553732
- PMCID: PMC3749248
- DOI: 10.1002/jbmr.1938
Ubiquitin E3 ligase Wwp1 negatively regulates osteoblast function by inhibiting osteoblast differentiation and migration
Abstract
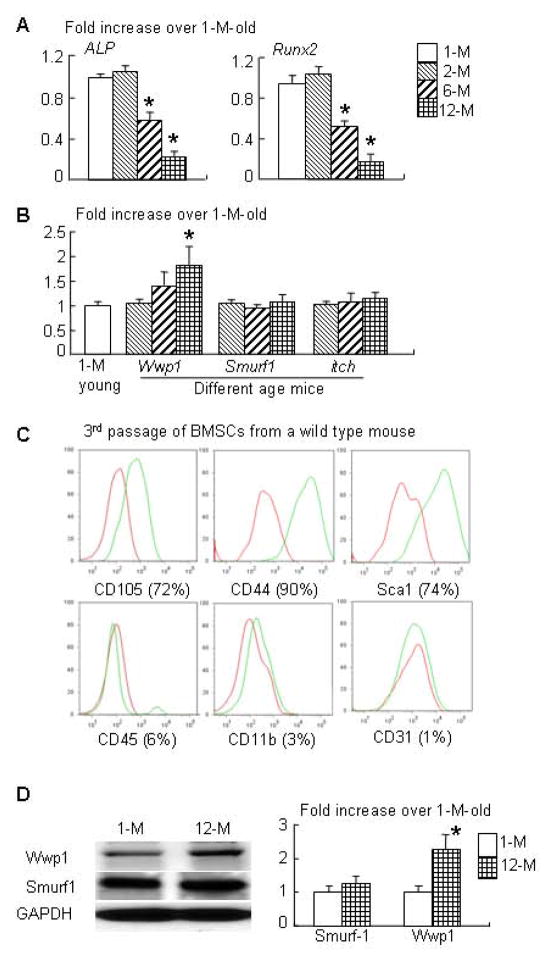
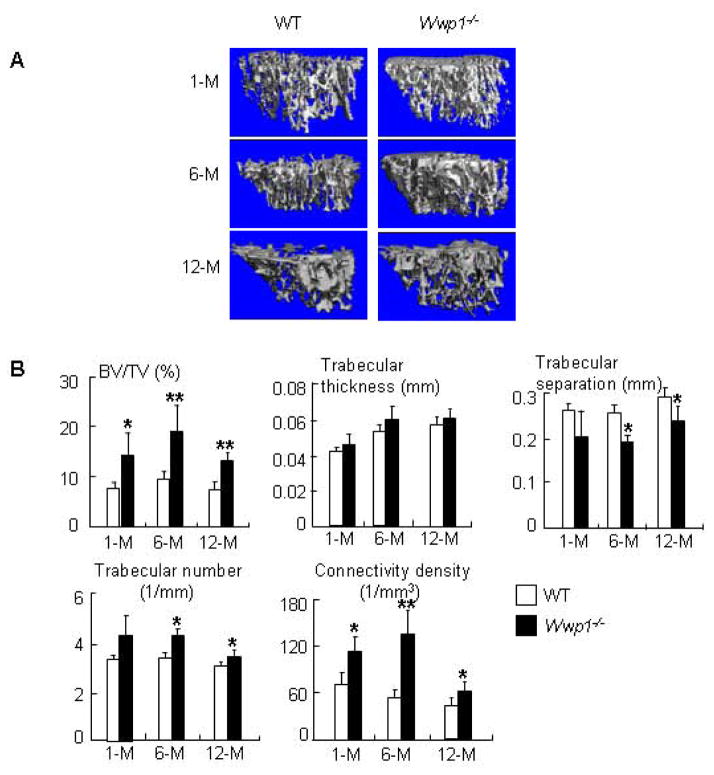
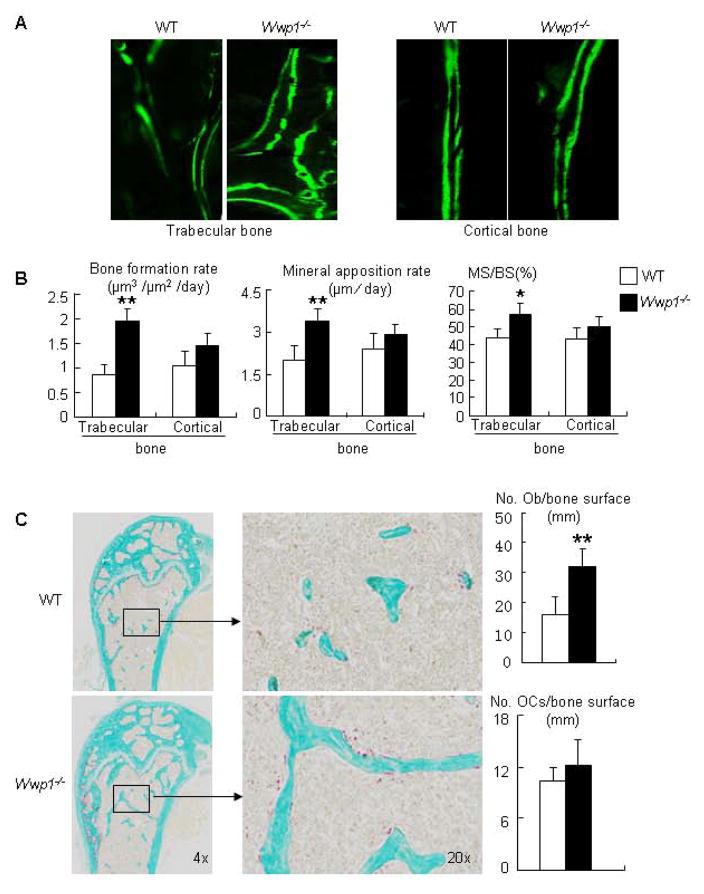
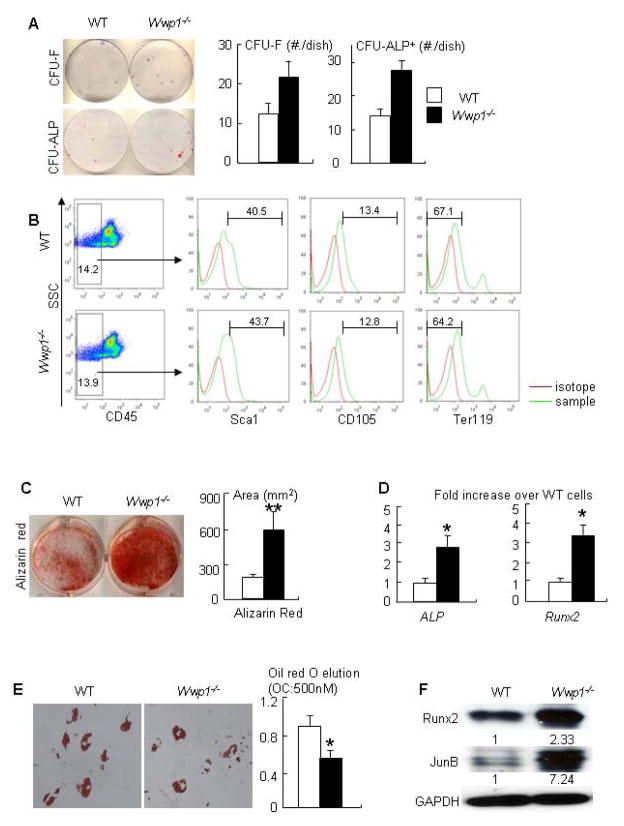
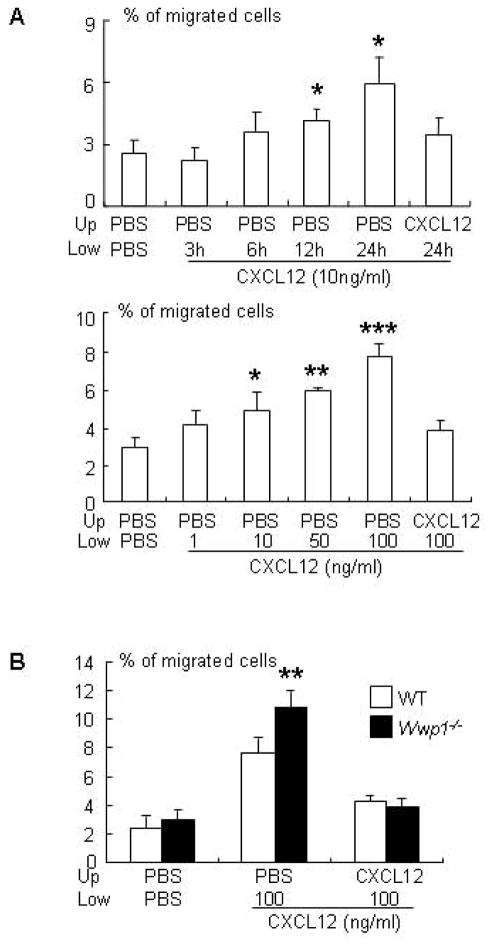
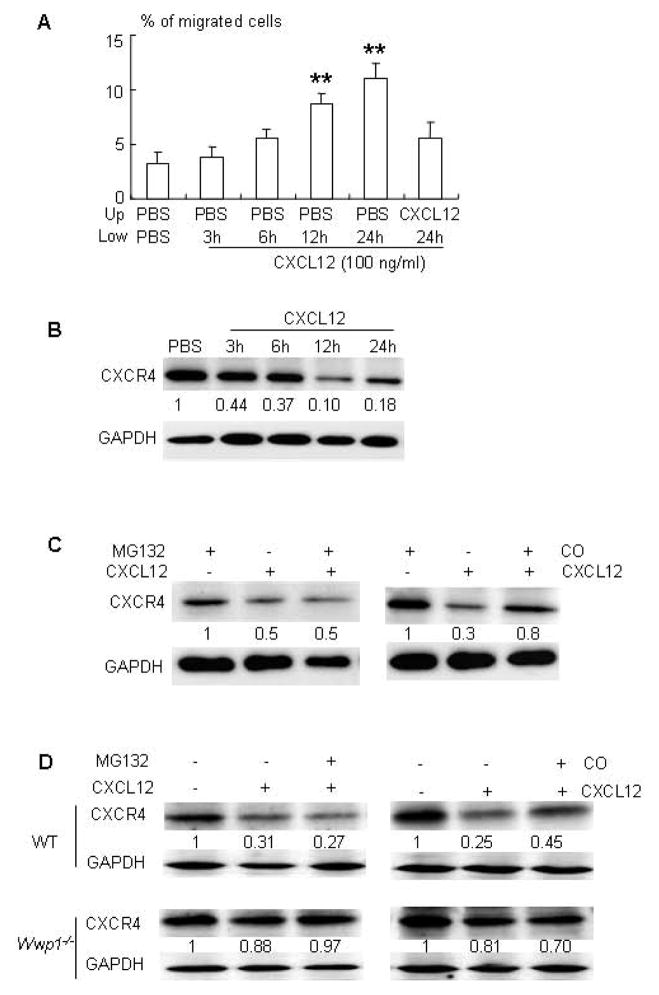
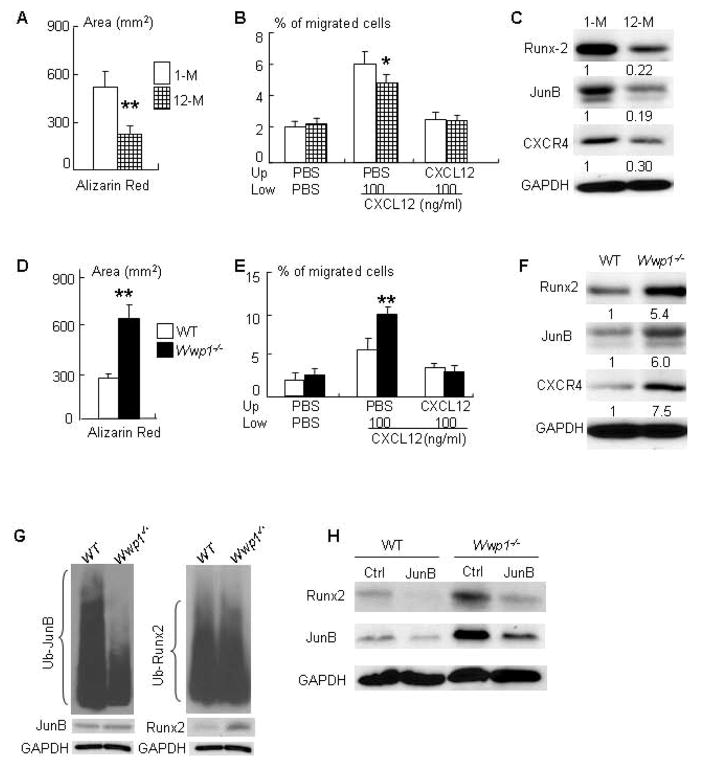
Ubiquitin E3 ligase-mediated protein degradation promotes proteasomal degradation of key positive regulators of osteoblast functions. For example, the E3 ligases--SMAD-specific E3 ubiquitin protein ligase 1 (Smurf1), Itch, and WW domain-containing E3 ubiquitin protein ligase 1 (Wwp1)--promote degradation of Runt-related transcription factor 2 (Runx2), transcription factor jun-B (JunB), and chemokine (C-X-C) receptor type 4 (CXCR-4) proteins to inhibit their functions. However, the role of E3 ligases in age-associated bone loss is unknown. We found that the expression level of Wwp1, but not Smurf1 or Itch, was significantly increased in CD45-negative (CD45(-)) bone marrow-derived mesenchymal stem cells from 6-month-old and 12-month-old wild-type (WT) mice. Wwp1 knockout (Wwp1(-/-)) mice developed increased bone mass as they aged, associated with increased bone formation rates and normal bone resorption parameters. Bone marrow stromal cells (BMSCs) from Wwp1(-/-) mice formed increased numbers and areas of alkaline phosphatase(+) and Alizarin red(+) nodules and had increased migration potential toward chemokine (C-X-C motif) ligand 12 (CXCL12) gradients. Runx2, JunB, and CXCR-4 protein levels were significantly increased in Wwp1(-/-) BMSCs. Wwp1(-/-) BMSCs had increased amount of ubiquitinated JunB protein, but Runx2 ubiquitination was no change. Knocking down JunB in Wwp1(-/-) BMSCs returned Runx2 protein levels to that in WT cells. Thus, Wwp1 negatively regulates osteoblast functions by affecting both their migration and differentiation. Mechanisms designed to decrease Wwp1 levels in BMSCs may represent a new approach to prevent the decrease in osteoblastic bone formation associated with aging.
Keywords: BONE FORMATION; MESENCHYMAL STEM CELLS; OSTEOBLASTS; WWP1.
© 2013 American Society for Bone and Mineral Research.
Conflict of interest statement
Figures
Similar articles
-
Tumor necrosis factor inhibits mesenchymal stem cell differentiation into osteoblasts via the ubiquitin E3 ligase Wwp1.Stem Cells. 2011 Oct;29(10):1601-10. doi: 10.1002/stem.703. Stem Cells. 2011. PMID: 21809421 Free PMC article.
-
Ubiquitin e3 ligase itch negatively regulates osteoblast differentiation from mesenchymal progenitor cells.Stem Cells. 2013 Aug;31(8):1574-83. doi: 10.1002/stem.1395. Stem Cells. 2013. PMID: 23606569 Free PMC article.
-
Smurf1 inhibits mesenchymal stem cell proliferation and differentiation into osteoblasts through JunB degradation.J Bone Miner Res. 2010 Jun;25(6):1246-56. doi: 10.1002/jbmr.28. J Bone Miner Res. 2010. PMID: 20200942 Free PMC article.
-
WWP1: a versatile ubiquitin E3 ligase in signaling and diseases.Cell Mol Life Sci. 2012 May;69(9):1425-34. doi: 10.1007/s00018-011-0871-7. Epub 2011 Nov 4. Cell Mol Life Sci. 2012. PMID: 22051607 Free PMC article. Review.
-
Regulatory Roles of E3 Ubiquitin Ligases and Deubiquitinases in Bone.Biomolecules. 2025 May 7;15(5):679. doi: 10.3390/biom15050679. Biomolecules. 2025. PMID: 40427572 Free PMC article. Review.
Cited by
-
Role of ubiquitination in the occurrence and development of osteoporosis (Review).Int J Mol Med. 2024 Aug;54(2):68. doi: 10.3892/ijmm.2024.5392. Epub 2024 Jun 28. Int J Mol Med. 2024. PMID: 38940355 Free PMC article. Review.
-
Regulation of the p53 Family Proteins by the Ubiquitin Proteasomal Pathway.Int J Mol Sci. 2019 Dec 30;21(1):261. doi: 10.3390/ijms21010261. Int J Mol Sci. 2019. PMID: 31905981 Free PMC article. Review.
-
Proteasome inhibition-enhanced fracture repair is associated with increased mesenchymal progenitor cells in mice.PLoS One. 2022 Feb 25;17(2):e0263839. doi: 10.1371/journal.pone.0263839. eCollection 2022. PLoS One. 2022. PMID: 35213543 Free PMC article.
-
The E3 ubiquitin ligase WWP2 facilitates RUNX2 protein transactivation in a mono-ubiquitination manner during osteogenic differentiation.J Biol Chem. 2017 Jul 7;292(27):11178-11188. doi: 10.1074/jbc.M116.772277. Epub 2017 May 12. J Biol Chem. 2017. PMID: 28500134 Free PMC article.
-
MiR-142-5p promotes bone repair by maintaining osteoblast activity.J Bone Miner Metab. 2017 May;35(3):255-264. doi: 10.1007/s00774-016-0757-8. Epub 2016 Apr 16. J Bone Miner Metab. 2017. PMID: 27085967
References
-
- McCarthy TL, Ji C, Centrella M. Links among growth factors, hormones, and nuclear factors with essential roles in bone formation. Crit Rev Oral Biol Med. 2000;11:409–22. - PubMed
-
- Lian JB, Javed A, Zaidi SK, Lengner C, Montecino M, van Wijnen AJ, Stein JL, Stein GS. Regulatory controls for osteoblast growth and differentiation: role of Runx/Cbfa/AML factors. Crit Rev Eukaryot Gene Expr. 2004;14:1–41. - PubMed
-
- Zuo C, Huang Y, Bajis R, Sahih M, Li YP, Dai K, Zhang X. Osteoblastogenesis regulation signals in bone remodeling. Osteoporos Int. 2012;23:1653–63. - PubMed
-
- Marie PJ, Kassem M. Osteoblasts in osteoporosis: past, emerging, and future anabolic targets. Eur J Endocrinol. 2011;165:1–10. - PubMed
Publication types
MeSH terms
Substances
Grants and funding
LinkOut - more resources
Full Text Sources
Other Literature Sources
Molecular Biology Databases
Research Materials
Miscellaneous
