. 2013 Nov;38(5):1094-102.
doi: 10.1002/jmri.24087. Epub 2013 Apr 1.

MRI-based prediction of pulsed high-intensity focused ultrasound effect on tissue transport in rabbit muscle

Affiliations

MRI-based prediction of pulsed high-intensity focused ultrasound effect on tissue transport in rabbit muscle

Brian E O'Neill et al. J Magn Reson Imaging. 2013 Nov.

Abstract

Purpose: To design an algorithm for optimizing pulsed high intensity focused ultrasound (p-HIFU) treatment parameters to maximize tissue transport while minimizing thermal necrosis based on MR image guidance.

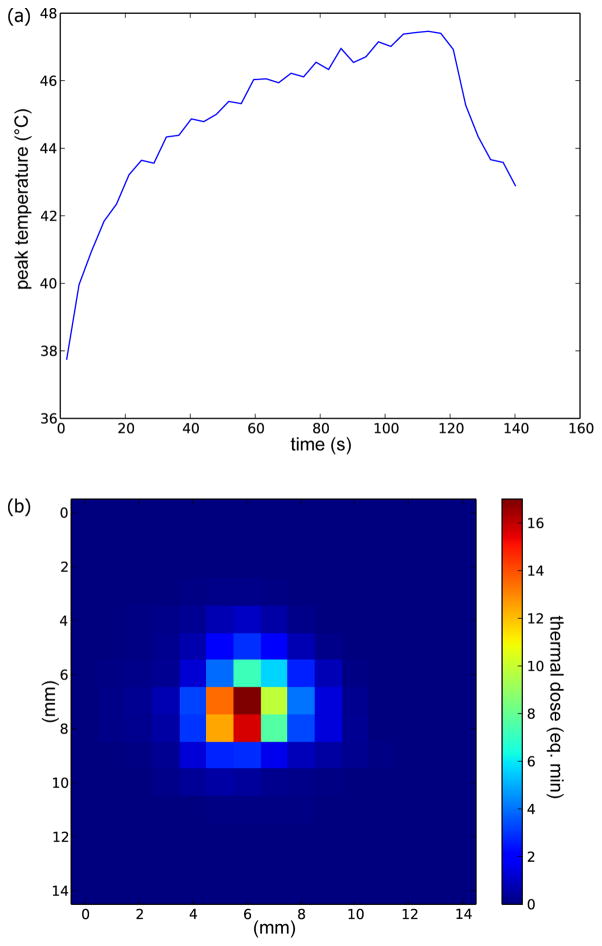
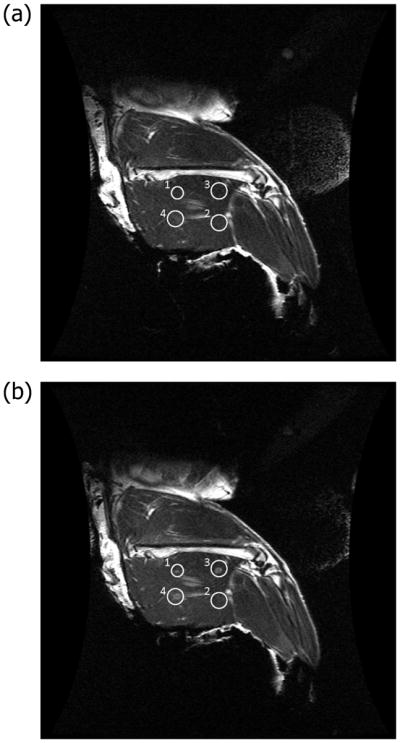
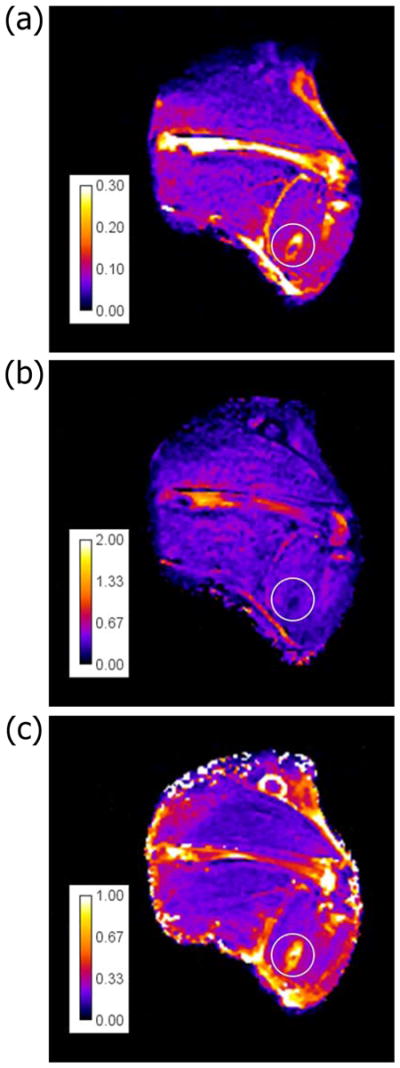
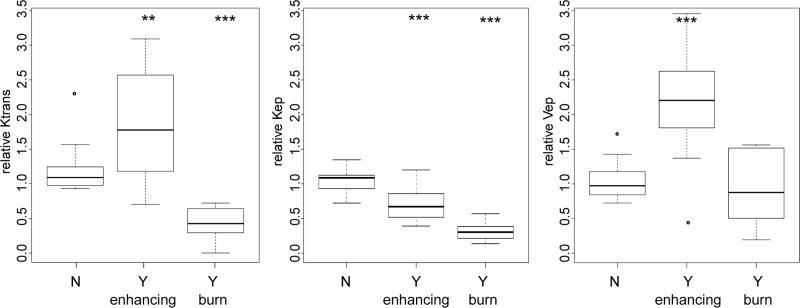
Materials and methods: P-HIFU power, duty cycle, and treatment duration were varied to generate different levels of thermal and mechanical deposition in rabbit muscle. Changes in T2-weighted and T1 contrast-enhanced (CE) signal were assessed immediately following treatment and at 24 h. Transport parameters were extracted by means of T1-weighted dynamic contrast-enhanced MRI (DCE-MRI) technique at 0 and 24-h time points.

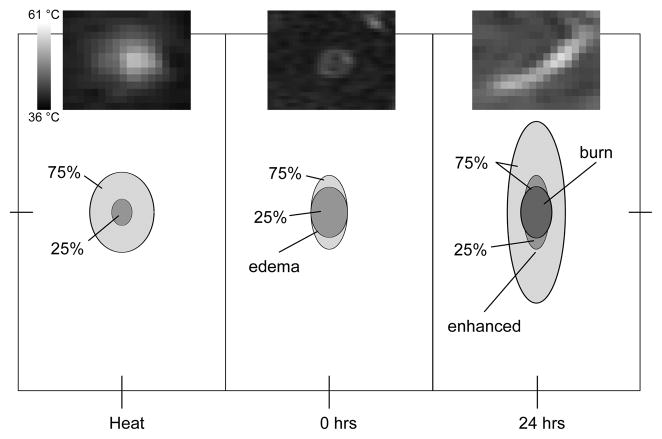
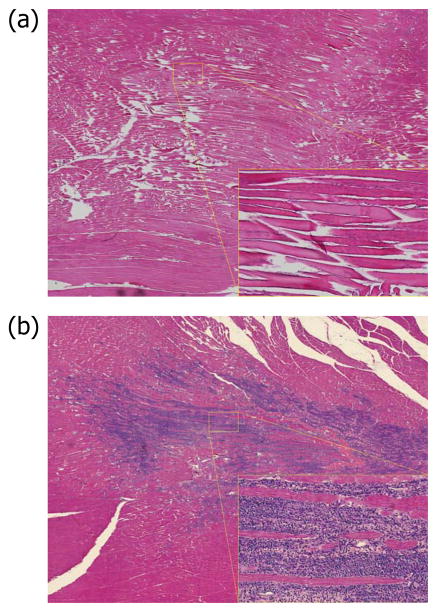
Results: Successful p-HIFU treatment was indicated by focal hyperintensity on the T2-weighted image immediately post-treatment, suggesting increased fluid (edema), with little intensity change in CE image. After 24 h, the affected region expanded along the muscle fiber accompanied by clear hyperintensity in CE image (contrast uptake). Quantitative DCE-MRI analysis revealed statistically significant increases in both leakage rate and extracellular space, accompanied by a decrease in clearance rate.

Conclusion: Successful p-HIFU treatment was mainly correlated to tissue heating. Tissue transport properties following treatment success would result in improved contact between drug and targets in both time and space. MRI is the key to controlling treatment by means of thermometry and also monitoring efficacy by means of T2-weighted imaging.

Keywords: MRI-guided focused ultrasound; clearance rate; drug delivery; dynamic contrast enhanced-MRI; pulsed high-intensity focused ultrasound; tissue permeability.


Figures

Figure 1
Figure 1
Temperature history of one focal spot during p-HIFU treatment (a) and corresponding thermal dose map (b).
Figure 2
Figure 2
Coronal T2-weighted MRI without contrast in the thigh muscle of a 3.4 kg female New Zealand rabbit. (a) Regions of interest (circles) are hypointense before p-HIFU treatment. (b) The four treatment spots (circles) are hyperintense after p-HIFU treatment.
Figure 3
Figure 3
Relative sizes and shapes of treated zones. (Left) heated zone (defined as the region reaching at least 43.25 °C); (Middle) T2-enhanced zone; (Right) contrast-enhanced zone and contrast-reduced (burn) zones at 24 hours. Shown are 25th and 75th percentiles of all measurements normalized by the minor axis of the edema at 0 hour. For the burn, the area of the 25th percentile is 0. The significant elongation (major axis) along the muscle fiber in the case of the contrast enhanced region suggests an effect mediated by the diffusion of inflammatory factors. Insets are thermal, T2, and CE images of spot 3 in Figure 2. Each image is 18 mm × 14 mm.
Figure 4
Figure 4
Histology from treated region of muscle at 0 hrs (a) and 24 hrs (b). The edema at 0 hrs is reflected in the loss of tissue structure, leading to acute inflammatory response at 24 hrs.
Figure 5
Figure 5
Prediction of edema following treatment. Partition tree (without pruning) for prediction of presence (TRUE) or absence (FALSE) of edema following p-HIFU treatment, based on peak acoustic power (Power), average power (Pave) and total energy (ETot) in the beam. Pave is clearly the most important parameter, dominating the first two levels of the tree. For example, a Pave of 10.25W breaks the entire set of observations (123 FALSE or edema not present, 54 TRUE or edema present) into predominantly edema not present group below 10.25W (97 FALSE vs. 10 TRUE) and a predominantly edema present group above 10.25W (26 FALSE vs. 44 TRUE). Power, which shows up at the third level of this tree, is not well correlated to the presence of edema.
Figure 6
Figure 6
Relationship between induced edema and thermal dose. A CEM43 of 159 minutes separates treatments into groups without (FALSE) and with (TRUE) edema (P < 10−15). Shown are medians, 25–75 percentiles (boxes) and 5–95 percentiles (whiskers).
Figure 7
Figure 7
Prediction of successful treatment. The partition tree shows the probability of success (contrast uptake and no burn) for p-HIFU treatments of 50–120 s that reach peak temperature, Tmx, in the ranges indicated. Tmx=42.41 °C divides the set of observations into 27 treatments of which 0 were successful and 46 treatments of which 26.09% (or 12) were successful and so on down the tree. The final groups arranged by peak temperature are Tmx<42.41 °C where 0 of the 27 treatments were successful, 42.41 °C ≤ Tmx<49.36 °C where 5 of 23 treatments (21.74%) were successful, 49.36 °C ≤ Tmx<52.51 °C where 6 of 11 treatments (54.55%) were successful, and 52.51 °C ≤ Tmx where 1 of 12 treatments (8.33%) was successful.
Figure 8
Figure 8
Contrast uptake after treatment. Areas of regions showing enhanced (filled, x) and reduced (wavy, o) contrast uptake at 24 hours after p-HIFU treatment dependence on max temperature (treatment time: 50–120 s). Box width is proportional to sample number.
Figure 9
Figure 9
Parameters distribution after treatment. Coronal distribution map for three parameters of tissue property at 24hrs after p-HIFU treatment of thigh muscle New Zealand rabbit. (a) ktrans, (b) kep, (c) ve.
Figure 10
Figure 10
Parameters distribution in different regions. Relative values of (from left to right) ktrans, kep and ve in unaffected regions, regions with enhanced contrast uptake, and regions of decreased contrast (burns). Significance is determined relative to the unaffected group (* P<0.05, ** P<0.01, *** P<0.001).

Similar articles

Cited by

References

    1. Yuh EL, Shulman SG, Mehta SA, et al. Delivery of systemic chemotherapeutic agent to tumors by using focused ultrasound: study in a murine model. Radiology. 2005;234:431–437. - PubMed
    1. Dittmar KM, Xie J, Hunter F, et al. Pulsed high-intensity focused ultrasound enhances systemic administration of naked DNA in squamous cell carcinoma model: Initial experience. Radiology. 2005;235:541–546. - PubMed
    1. Frenkel V, Etherington A, Greene M, et al. Delivery of liposomal doxorubicin (Doxil) in a breast cancer tumor model: Investigation of potential enhancement by pulsed-high intensity focused ultrasound exposure. Academic Radiol. 2006;13:469–479. - PubMed
    1. Khaibullina K, Jang BS, Sun H, et al. Pulsed high intensity focused ultrasound enhances uptake of radiolabeled monoclonal antibody to human epidermoid tumor in nude mice. J Nucl Med. 2008;49:295–302. - PubMed
    1. Frenkel V, Oberoi J, Stone MJ, et al. Pulsed high-intensity focused ultrasound enhances thrombolysis in an in vitro model. Radiology. 2006;239:86–93. - PMC - PubMed

Publication types

LinkOut - more resources