. 2013 Jul;34(7):974-85.
doi: 10.1002/humu.22327. Epub 2013 Apr 23.

Transduction-specific ATLAS reveals a cohort of highly active L1 retrotransposons in human populations

Affiliations

Transduction-specific ATLAS reveals a cohort of highly active L1 retrotransposons in human populations

Catriona M Macfarlane et al. Hum Mutat. 2013 Jul.

Abstract

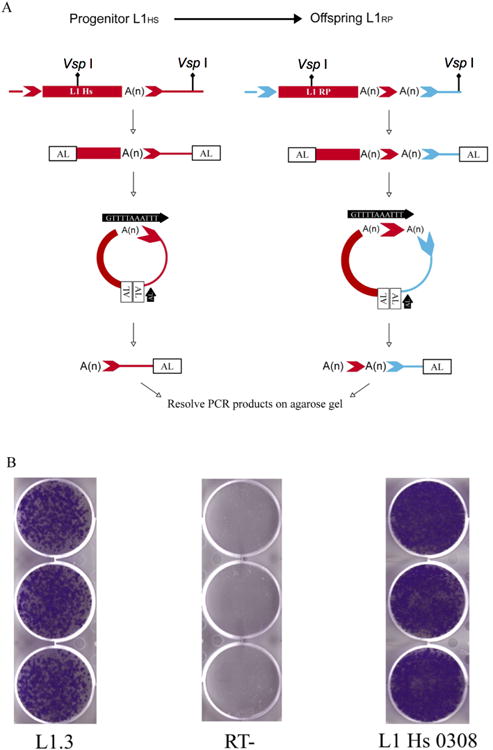
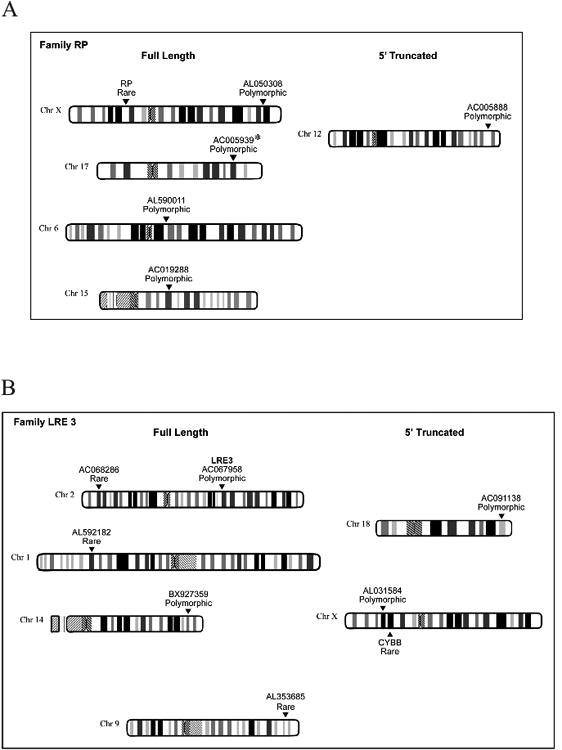
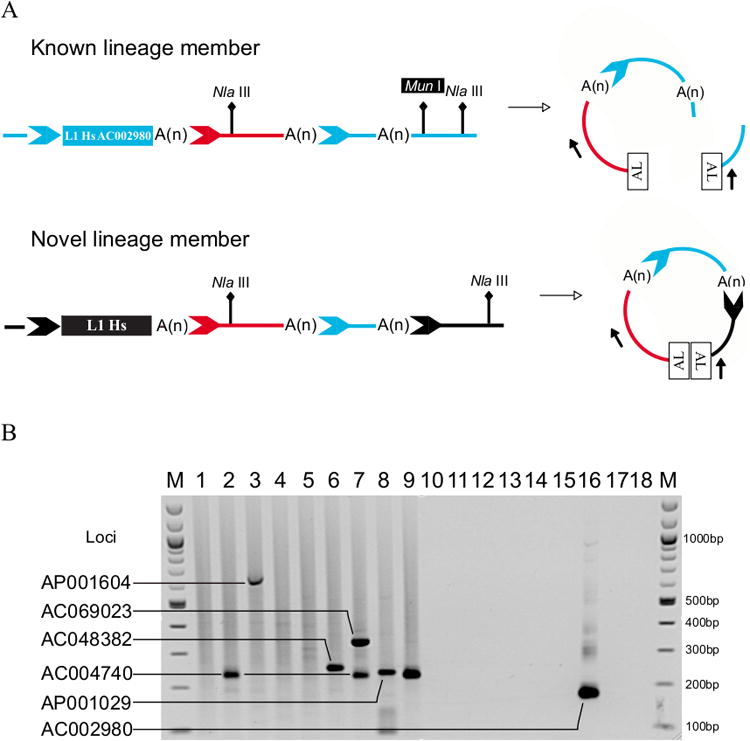
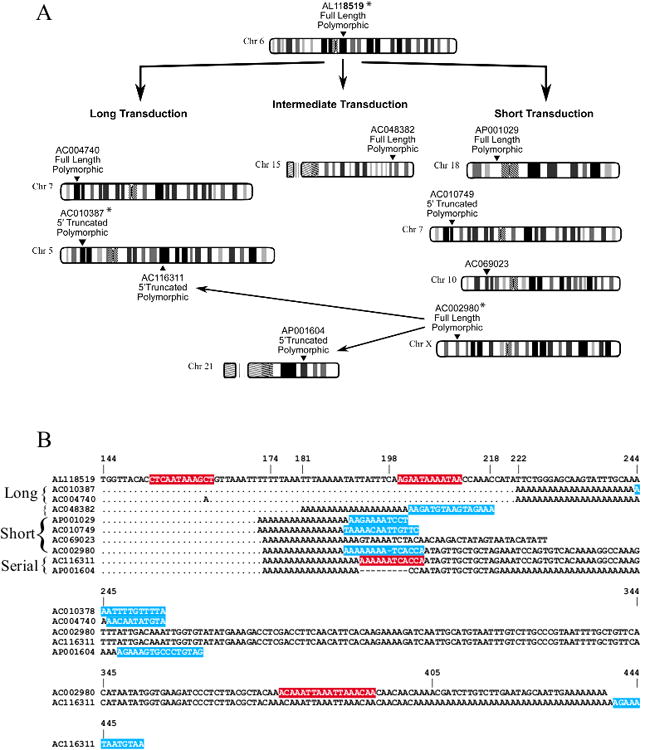
Long INterspersed Element-1 (LINE-1 or L1) retrotransposons are the only autonomously active transposable elements in the human genome. The average human genome contains ∼80-100 active L1s, but only a subset of these L1s are highly active or 'hot'. Human L1s are closely related in sequence, making it difficult to decipher progenitor/offspring relationships using traditional phylogenetic methods. However, L1 mRNAs can sometimes bypass their own polyadenylation signal and instead utilize fortuitous polyadenylation signals in 3' flanking genomic DNA. Retrotransposition of the resultant mRNAs then results in lineage specific sequence "tags" (i.e., 3' transductions) that mark the descendants of active L1 progenitors. Here, we developed a method (Transduction-Specific Amplification Typing of L1 Active Subfamilies or TS-ATLAS) that exploits L1 3' transductions to identify active L1 lineages in a genome-wide context. TS-ATLAS enabled the characterization of a putative active progenitor of one L1 lineage that includes the disease causing L1 insertion L1RP , and the identification of new retrotransposition events within two other "hot" L1 lineages. Intriguingly, the analysis of the newly discovered transduction lineage members suggests that L1 polyadenylation, even within a lineage, is highly stochastic. Thus, TS-ATLAS provides a new tool to explore the dynamics of L1 lineage evolution and retrotransposon biology.


Conflict of interest statement

Conflict of Interests Statement: The authors assert that there are no Conflicts of Interest associated with the reported research. In the interests of full disclosure J.V.M. is an inventor on the following patent: Compositions and methods of use of human retrotransposons. Application No. 60/006,831; Patent number 6,150,160; Issued November 21, 2000. His involvement with this patent is disclosed voluntarily and does not influence the content or conclusions of this study.

Figures

Figure 1
Figure 1. Schematic of RP-Specific TS-ATLAS and Activity of L1 AL050308
A. TS-ATLAS Using a Primer Specific to the RP Transduction Shown on the right is an offspring L1 (red rectangle, labeled “L1 RP”) of a progenitor L1 (red rectangle to the left, labelled “L1 Hs”), which carries two poly (A) tails (A(n).) These poly (A) tails are separated by a short transduced sequence consisting of the progenitor's target site duplication sequence (red chevron), and flanked by distinct TSDs (light blue chevrons). PCR reactions containing linker specific (Black arrow, labelled “AL”) and transduction specific primers (Black arrow, labelled with RP transduction sequence) and using linkered genomic DNA libraries as a template enable specific amplification of both types of element. Offspring elements are identifiable by the presence of a poly (A) tail downstream of the transduction sequence (red chevron), while progenitor elements lack this. Sequencing of transduction PCR products enables their 3′ flanking genomic DNA to be used to determine if they originate from novel insertions. B. Retrotransposition of Putative Lineage Progenitor L1 AL050308 TS-ATLAS was used to identify a putative novel progenitor for the RP lineage, inserted into genomic accession AL050308. The three panels show the results of representative duplicate cell culture based retrotransposition assays using L1 elements cloned into standard assay vectors. L1.3 (Accession L10988) is a reference element: its ability to generate G418 resistant HeLa cell colonies (left panel) was compared to that of the putative L1RP progenitor, AL050308 (right panel). This clone of the AL050308 element has no nucleotide changes from the genomic consensus sequence of the L1, and retrotransposes at ∼170% the rate of L1.3 (n=6). As a negative control an L1 construct with an inactivating mutation in the RT domain of ORF2p in L1.3 (Wei et al., 2001; Wei et al., 2000) was assayed under the same conditions (middle panel, RT-).
Figure 2
Figure 2. L1 Transduction Families
Data presented in Figure 3 are compiled from this and other studies (Myers et al., 2002; Beck et al., 2010; Goodier et al., 2000; Brouha et al., 2002; Kimberland et al., 1999). Ideograms were adapted from the NCBI map viewer website (http://www.ncbi.nlm.nih.gov/projects/mapview/). A. Transduction Family RP. The RP family is characterised by a transduction putatively derived from the L1 locus AL050308. AL050308, AL590011, AC005939, AL019288, and L1RP are full length and AC005888 is 5´ truncated. L1RP is a disease causing insertion (Kimberlandet al., 1999). Asterisks (*) denote L1s present in the human genome reference assembly (hg18). Insertion AC093861 is not included as the absence of TSDs (see Table 1) means we cannot exclude a non-TPRT mechanism for its mobilisation. B. Transduction Family LRE3. The LRE3 family is characterised by a transduction originally derived from the L1 locus LRE3. LRE3, BX927359, AC068286, AL592182, and AL353685 are full length. AC091138 and AL031584 are 5´ truncated. L1CYBB is a disease causing insertion (Meischlet al., 2000).
Figure 3
Figure 3. Schematic of TS-ATLAS with Common Allele Suppression
A. Amplification of L1 AC002980 is Prevented by Digestion with Mun I. A commonly known transduction family member (upper panel, blue rectangle, labelled “L1Hs AC002980”) carries a lineage specific transduction (red line and chevron) and is flanked by distinct TSDs (light blue chevrons). L1 AC002980 competes with the amplification of novel lineage members. By selecting a rare restriction site (MunI) in the 3′ flanking DNA of this element, upstream of the NlaIII linker site, pre-digestion of linkered genomic libraries suppresses its amplification. Novel lineage members directly derived from L1 AC002980 carry the lineage specific transduction (red line and chevron) and a second transduction (light blue line and chevron) and are flanked by distinct TSDs (black chevron). Novel members most likely lack the combination of the rare cutting (MunI) restriction enzyme upstream of a very common NlaIII site, and so their amplification is not suppressed. B. Representative TS-ATLAS Display Gel Showing the Results of Applying the AC002980-Specific (NlaIII) Assay. Lanes 1-9 show display patterns of 9 unrelated individuals each of whom carries the AC002980 L1. Control reactions in lanes 11, 13, 14, and 16 were setup using the same library sample as is shown in Lane 9. Lane 16 shows the amplification of the AC002980 locus, which is suppressed by digestion with MunI in lanes 1-9. Lanes 2, 7, and 9 show amplification of the AC004740 locus. Lane 3 shows amplification of the AP001604 locus. Lane 6 shows amplification of the AC048382 locus. Lane 7 shows amplification of the AC069023 locus. Lane 8 shows amplification of the AP001029 locus. Lane 10 - Reaction in the absence of genomic DNA. Lane 11 - Reaction in the absence of restriction enzyme (NlaIII). Lane 12 - Reaction in the absence of genomic DNA. Lane 13 - Reaction in the absence of T4 Ligase. Lane 14 - Reactions in the absence of linker. Lane 15 - Reaction in the absence of digested genomic DNA. Lane 16 - Reaction in the absence of supression enzyme digestion (MunI). Lane 17 - Control for primary PCR with DNA omitted. Lane 18 - Control for secondary PCR with DNA omitted. MW - molecular weight marker (100bp ladder (NEB)). All labelled bands were sequenced to verify their origin.
Figure 4
Figure 4. Variable Transduction Lengths in the AC002980 Family
A. Characteristics and Putative Relationships of the AC002980 Family Data presented here are compiled from this study and other publications (Myers et al., 2002; Beck et al., 2010; Goodier et al., 2000; Brouha et al., 2002; Kimberland et al., 1999). Putative relationships of L1 loci are indicated by arrows. Ideograms were adapted from the NCBI map viewer (http://www.ncbi.nlm.nih.gov/projects/mapview/). The AC002980 family contains elements characterized by alternative polyadenylation resulting in variable lengths of transduced sequence. The long, intermediate, and short transductions are derived from the progenitor locus AL118519. Loci AC004740 and AC010387 retain the long transduction, AC048382 contains an intermediate length transduction, while AP001029, AC010749, AC068023, and AC002980 have a shorter transduction. AP001604 and AC116311 contain sequences putatively derived from the AC002980locus. Asterisks (*) denote L1s present in the human genome reference assembly (hg18). B. Multiple Alignment Showing Variable Transduction Lengths and Putative Polyadenylation Sites in the AC002980 Lineage. Dots represent identical nucleotides and dashes are gaps in the alignment. The alignment begins 144bp downstream from the start of the transduced sequence. Initially the alignment (bases 144-222) is against the 3′ flanking sequence of the progenitor locus AL118519, starting within the transduced region and showing transduction length variants derived from locus AL118519. Short transduction lengths end at bases 173/174, The intermediate transduction of AC048382 ends at base 181, and long transduction lengths end at base 222. Following this (bases 198-405) the alignment shows the direct offspring of the AC002980 locus, with AP001604 ending at base 218 and AC116311 base 405. Sections highlighted in red are predicted poly(A) signal regions determined using the Hamming-Clustering (HC) network analysis (http://zeus2.itb.cnr.it/∼webgene/wwwHC_poly(A).html). Target Site Duplications (TSDs), confirmed by sequencing, are highlighted in blue.

References

    1. 1000 Genomes Project Consortium. Abecasis GR, Altshuler D, Auton A, Brooks LD, Durbin RM, Gibbs RA, Hurles ME, McVean GA. A map of human genome variation from population-scale sequencing. Nature. 2010 2010 Oct 28;467(7319):1061–73. - PMC - PubMed
    1. Altschul SF, Gish W, Miller W, Myers EW, Lipman DJ. Basic local alignment search tool. J MolBiol. 1990;215:403–10. - PubMed
    1. Badge RM, Alisch RS, Moran JV. ATLAS: A system to selectively identify human-specific L1 insertions. Am J Hum Genet. 2003;72:823–38. - PMC - PubMed
    1. Baillie JK, Barnett MW, Upton KR, Gerhardt DJ, Richmond TA, De Sapio F, Brennan PM, Rizzu P, Smith S, Fell M, Talbot RT, Gustincich S, Freeman TC, Mattick JS, Hume DA, Heutink P, Carninci P, Jeddeloh JA, Faulkner GJ. Somatic retrotransposition alters the genetic landscape of the human brain. Nature. 2011;479:534–537. - PMC - PubMed
    1. Beck CR, Collier P, Macfarlane C, Malig M, Kidd JM, Eichler EE, Badge RM, Moran JV. LINE-1 retrotransposition activity in human genomes. Cell. 2010;141:1159–1170. - PMC - PubMed

Publication types