. 2013 Apr 16;110(16):6524-9.
doi: 10.1073/pnas.1303932110. Epub 2013 Apr 3.

NeuroD1 regulates survival and migration of neuroendocrine lung carcinomas via signaling molecules TrkB and NCAM

Affiliations

NeuroD1 regulates survival and migration of neuroendocrine lung carcinomas via signaling molecules TrkB and NCAM

Jihan K Osborne et al. Proc Natl Acad Sci U S A. .

Abstract

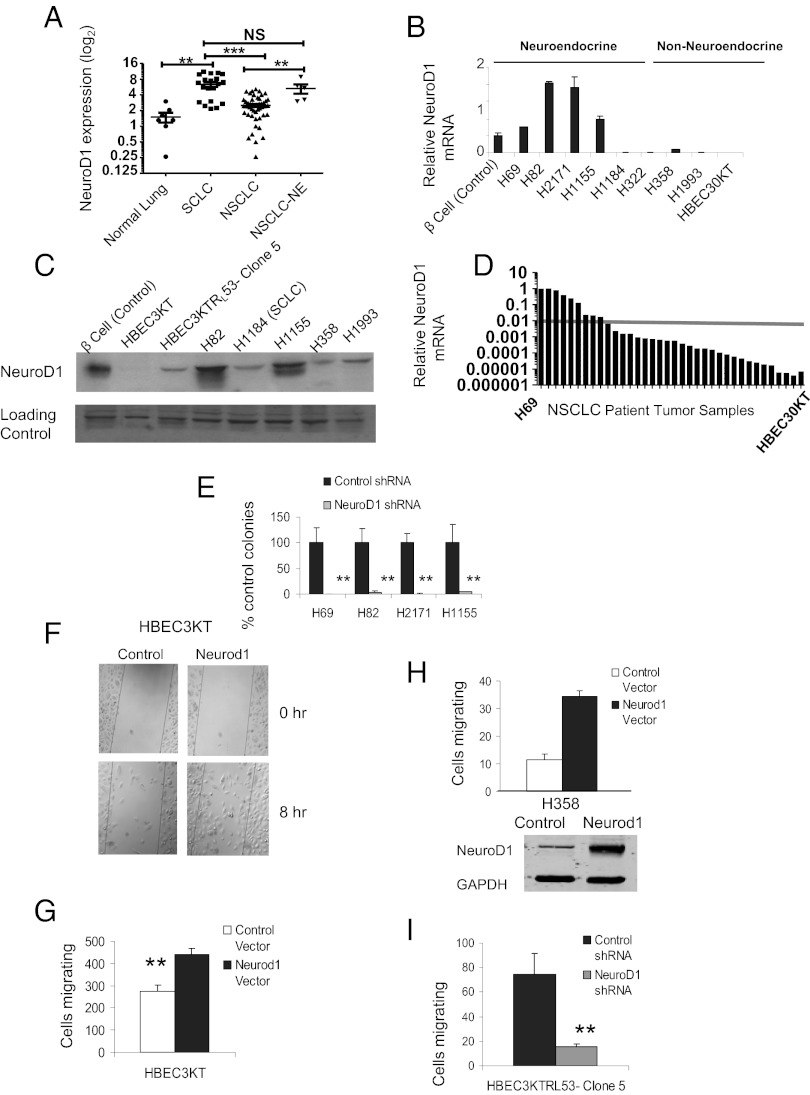
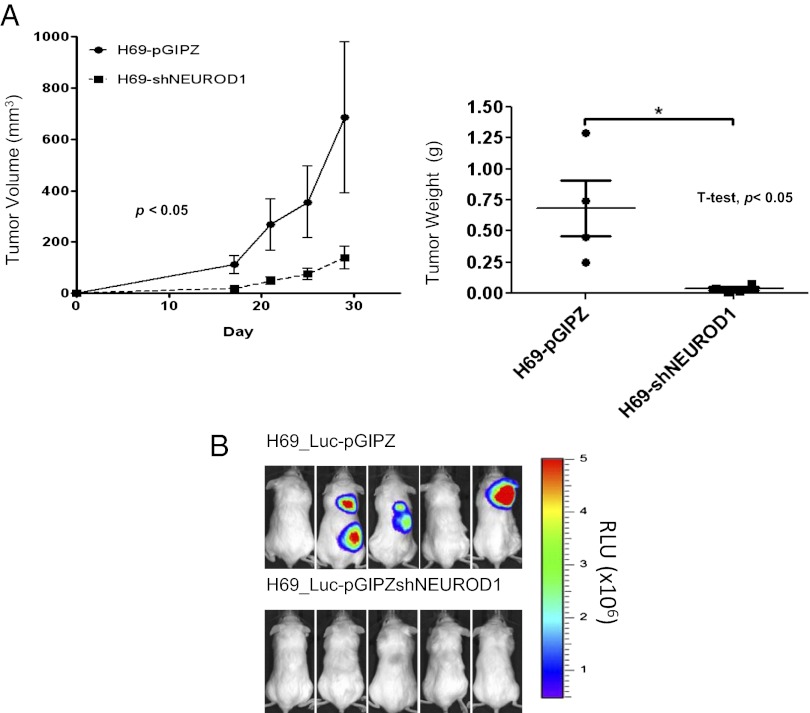
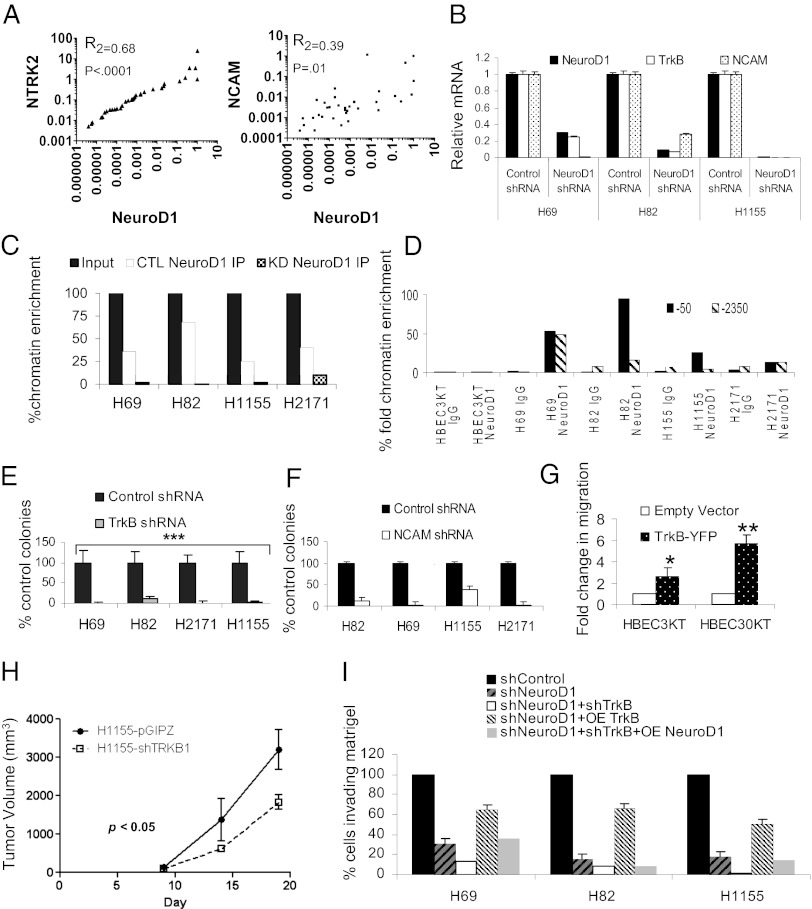
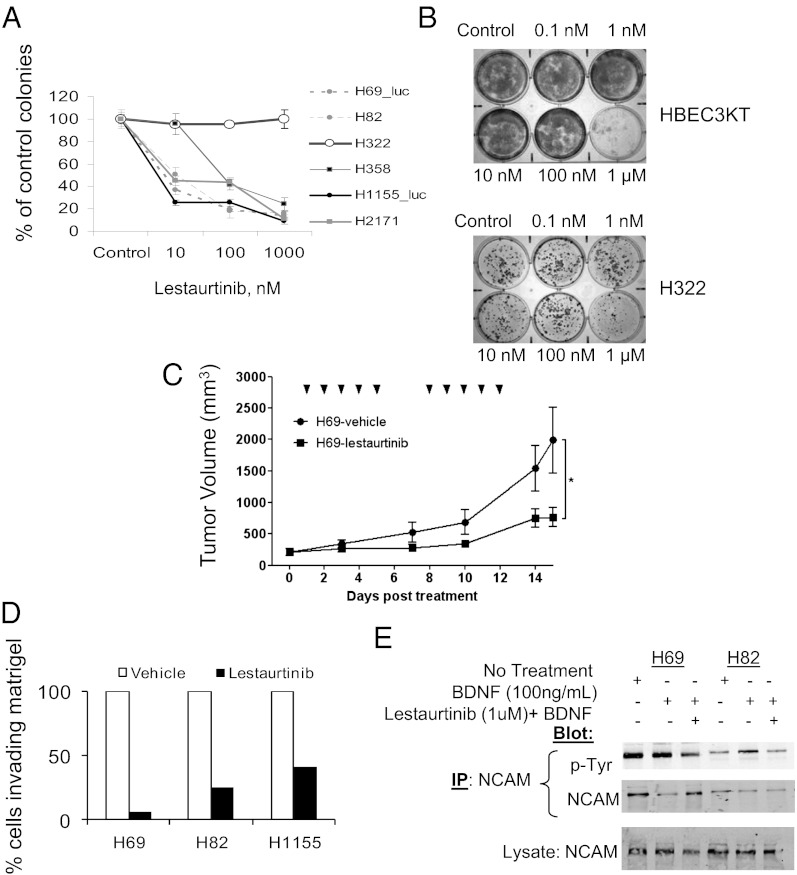
Small-cell lung cancer and other aggressive neuroendocrine cancers are often associated with early dissemination and frequent metastases. We demonstrate that neurogenic differentiation 1 (NeuroD1) is a regulatory hub securing cross talk among survival and migratory-inducing signaling pathways in neuroendocrine lung carcinomas. We find that NeuroD1 promotes tumor cell survival and metastasis in aggressive neuroendocrine lung tumors through regulation of the receptor tyrosine kinase tropomyosin-related kinase B (TrkB). Like TrkB, the prometastatic signaling molecule neural cell adhesion molecule (NCAM) is a downstream target of NeuroD1, whose impaired expression mirrors loss of NeuroD1. TrkB and NCAM may be therapeutic targets for aggressive neuroendocrine cancers that express NeuroD1.


Conflict of interest statement

The authors declare no conflict of interest.

Figures

Fig. 1.
Fig. 1.
NeuroD1 regulates survival and metastasis of neuroendocrine lung cancers. (A) mRNA expression in 86 cell lines, 8 HBEC, 56 NSCLC, and 22 SCLC, was assessed using Affymetrix HG-U133A and B GeneChips. Cell lines were categorized histopathologically and by NEUROD1 expression (**P < 0.001, ***P < 0.0001; two-tailed t test). (B and C) NeuroD1 expression was validated via quantitative RT-PCR (qRT-PCR) and immunoblotting in cell lines from each type noted above; 50 μg of protein was loaded per lane, and NFAT was used as loading control. Pancreatic beta-cell lines are positive controls. (D) Thirty-five adenocarcinoma and squamous patient samples analyzed via qRT-PCR to confirm NEUROD1 expression. Values were normalized to H69 values. The arbitrary line compares expression of NEUROD1 in the normal bronchial epithelial cell line HBEC30KT. (E) Soft agar assays of H69, H82, and H2171 and H1155 infected with shControl or shNeuroD1. Cells were sorted by expression for GFP on the GIPZ plasmids. Plotted are average number of colonies after 2 wk. Error bars represent ±SD of four independent experiments in triplicate (**P < 0.001; one-way ANOVA). (F–H) HBEC3KT and H358 cells were transfected with pCMV-Neurod1, and then subjected to Transwell or wound-healing assay. Graph represents mean ± SD of three independent experiments in duplicate for HBEC3KT (**P < 0.001; one-way ANOVA). (I) Clone 5 cells infected with shNeuroD1 or shControl were subjected to Transwell assay. Graph represents mean ± SD of three independent experiments in triplicate (**P < 0.001; one-way ANOVA).
Fig. 2.
Fig. 2.
NeuroD1 is required for tumorigenesis and metastasis in neuroendocrine lung. (A) NOD/SCID female mice were injected with 106 H69 cells infected with shNeuroD1 or shControl. Tumors were measured every 3–5 d until maximum tumor burden was reached. (n = 10, 5 mice per group). P values were computed by linear regression (of slopes) for volume measurements and Student t test for weights. Means are ±SEM. (B) The H69-luc cell line was infected with shcontrol or shNeuroD1. A total of 106 cells was injected into the tail vein of mice and monitored for metastases via bioluminescence imaging.
Fig. 3.
Fig. 3.
TrkB and NCAM are downstream targets of NeuroD1 that phenocopy loss of NeuroD1. (A) XY scatter plots of 35 adenocarcinoma and squamous patient samples examining correlation between NEUROD1, NRTK2 (TrkB), and NCAM. P values and R2 values were obtained by Pearson’s test. (B) qRT-PCR analysis of NRTK2, NCAM, and NEUROD1 in lung cancer cells with stable knockdown of NeuroD1. (C) ChIP of NeuroD1 on NTRK2 promoter in cell lines expressing shNeuroD1 or shcontrol (GIPZ). One of four independent experiments in duplicate. (D) ChIP of NeuroD1 on two E boxes in the NCAM promoter with NeuroD1 consensus binding sites in HBEC3KT, three SCLCs, and a NSCLC-NE. NeuroD1 immunoprecipitation values were compared with input, and then plotted as percentage chromatin fold enrichment normalized to HBEC-3KT. (E) Soft agar assay of SCLC and NSCLC-NE lines infected with shControl or shTrkB. The average numbers of colonies after 2 wk are shown. Error bars indicate ±SD from the mean of four independent experiments in triplicate (***P < 0.001; one-way ANOVA). (F) Cell lines were infected with shControl or shNCAM and subjected to soft agar assay. The average numbers of colonies after two weeks are shown. Error bars indicate ±SD from the mean of two independent experiments in triplicate. (G) HBEC3KT and HBEC30KT cells were transfected with a plasmid encoding human TrkB, and then subjected to Transwell assay. Graph represents fold mean ± SD of four and three independent experiments, respectively (**P < 0.005, *P < 0.05; one-way ANOVA). (H) Mice were injected with 106 H1155 cells infected with shNeuroD1 or shControl. Tumors were measured until maximum tumor burden was reached (n = 10, 5 mice per group). P values were computed by linear regression (of slopes) for volume measurements. Means are ±SEM. (I) H69, H82, and H1155 were cell lines were subjected to knockdown of NeuroD1 and/or NeuroD1/TrkB. Knockdown cells were then subjected to overexpression of either NeuroD1 or TrkB. Cells were then embedded in growth factor-reduced Matrigel, for Transwell migration assays as described in Experimental Procedures.
Fig. 4.
Fig. 4.
Lestaurtinib regulates survival and invasion. (A) Soft agar assays of SCLC and NSCLC-NE cells treated with 10, 100, and 1,000 nM lestaurtinib. (B) Liquid colony assays of HBEC3KT and the NSCLC cell line H322 exposed to increasing concentrations of lestaurtinib. (C) A total of 106 H69-Luc cells was s.c. injected into the flank of mice and monitored every 2–3 d. Lestaurtinib or vehicle treatment commenced once tumor volume reached ∼200 mm3. n = 10 for each group. The tick marks represent treatment days (*P ≤ 0.05; Student t test). (D) Transwell assays of H69, H82, and H1155 embedded in a 1-mm-thick layer of growth factor-reduced Matrigel with or without 100 μM lestaurtinib. (E) SCLC were serum starved for 8 h, and then treated with 100 ng/mL BDNF without or with 1 μM lestaurtinib for 30 min. NCAM was immunoprecipitated and blotted with anti-phosphotyrosine. Representative of four independent experiments.

References

    1. Fischer B, Arcaro A. Current status of clinical trials for small cell lung cancer. Rev Recent Clin Trials. 2008;3(1):40–61. - PubMed
    1. Jackman DM, Johnson BE. Small-cell lung cancer. Lancet. 2005;366(9494):1385–1396. - PubMed
    1. Sato M, Shames DS, Gazdar AF, Minna JD. A translational view of the molecular pathogenesis of lung cancer. J Thorac Oncol. 2007;2(4):327–343. - PubMed
    1. Sun S, Schiller JH, Spinola M, Minna JD. New molecularly targeted therapies for lung cancer. J Clin Invest. 2007;117(10):2740–2750. - PMC - PubMed
    1. Radice PA, et al. The clinical behavior of “mixed” small cell/large cell bronchogenic carcinoma compared to “pure” small cell subtypes. Cancer. 1982;50(12):2894–2902. - PubMed

Publication types

MeSH terms

Associated data