

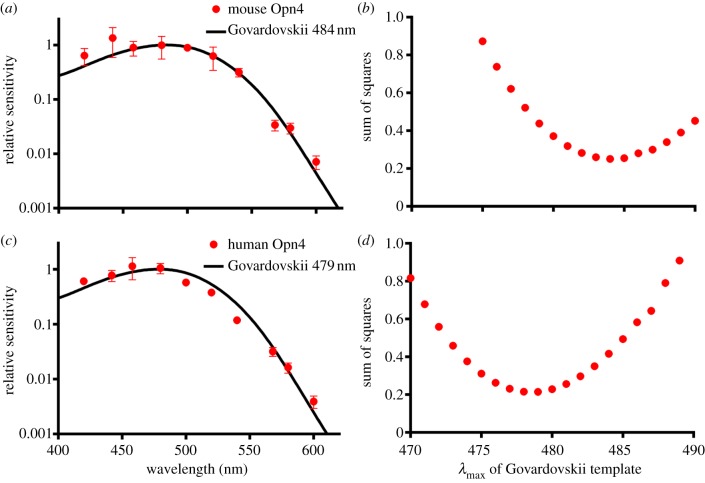
Human melanopsin forms a pigment maximally sensitive to blue light (λmax ≈ 479 nm) supporting activation of G(q/11) and G(i/o) signalling cascades
- PMID: 23554393
- PMCID: PMC3619500
- DOI: 10.1098/rspb.2012.2987
Human melanopsin forms a pigment maximally sensitive to blue light (λmax ≈ 479 nm) supporting activation of G(q/11) and G(i/o) signalling cascades
Abstract
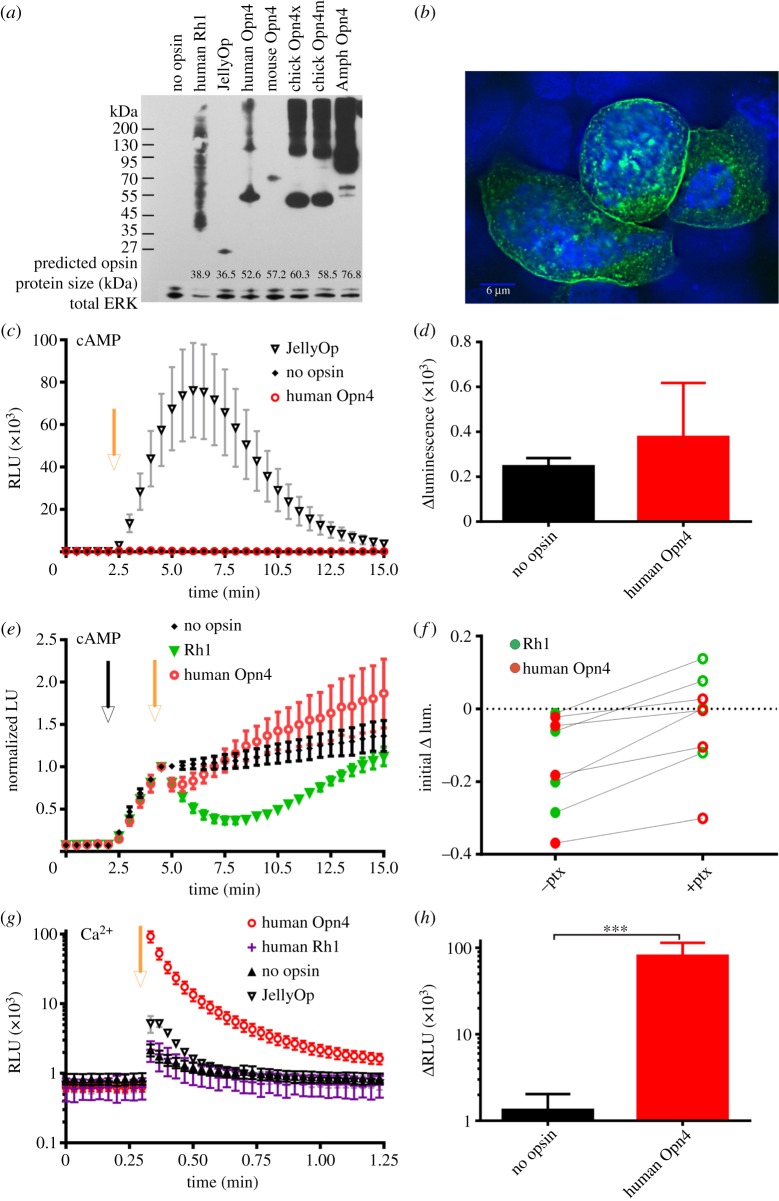
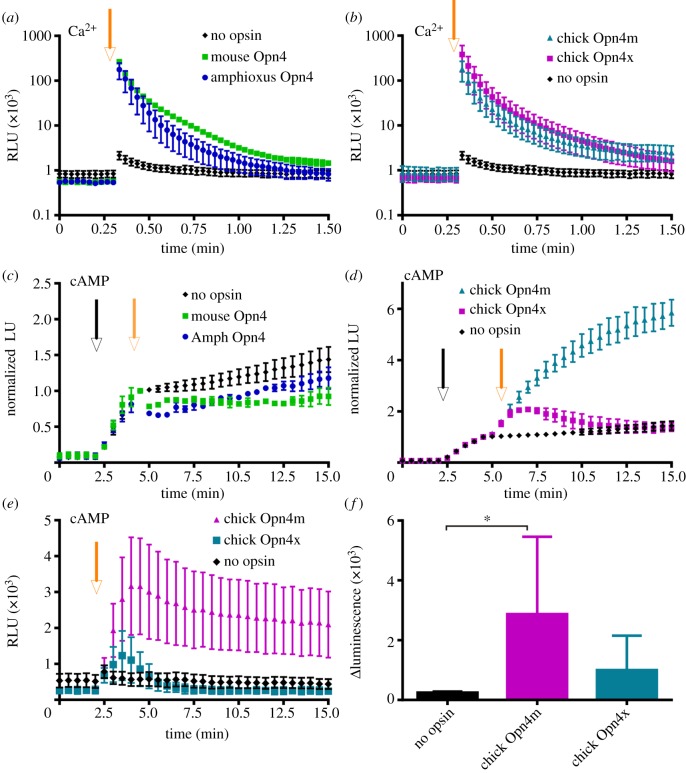
A subset of mammalian retinal ganglion cells expresses an opsin photopigment (melanopsin, Opn4) and is intrinsically photosensitive. The human retina contains melanopsin, but the literature lacks a direct investigation of its spectral sensitivity or G-protein selectivity. Here, we address this deficit by studying physiological responses driven by human melanopsin under heterologous expression in HEK293 cells. Luminescent reporters for common second messenger systems revealed that light induces a high amplitude increase in intracellular calcium and a modest reduction in cAMP in cells expressing human melanopsin, implying that this pigment is able to drive responses via both Gq and Gi/o class G-proteins. Melanopsins from mouse and amphioxus had a similar profile of G-protein coupling in HEK293 cells, but chicken Opn4m and Opn4x pigments exhibited some Gs activity in addition to a strong Gq/11 response. An action spectrum for the calcium response in cells expressing human melanopsin had the predicted form for an opsin : vitamin A1 pigment and peaked at 479 nm. The G-protein selectivity and spectral sensitivity of human melanopsin is similar to that previously described for rodents, supporting the utility of such laboratory animals for developing methods of manipulating this system using light or pharmacological agents.
Figures
References
-
- Fung BK, Hurley JB, Stryer L. 1981. Flow of information in the light-triggered cyclic nucleotide cascade of vision. Proc. Natl Acad. Sci. USA 78, 152–156 10.1073/pnas.78.1.152 (doi:10.1073/pnas.78.1.152) - DOI - PMC - PubMed
-
- Terakita A, Koyanagi M, Tsukamoto H, Yamashita T, Miyata T, Shichida Y. 2004. Counterion displacement in the molecular evolution of the rhodopsin family. Nat. Struct. Mol. Biol. 11, 284–289 10.1038/nsmb731 (doi:10.1038/nsmb731) - DOI - PubMed
-
- Kojima D, Terakita A, Ishikawa T, Tsukahara Y, Maeda A, Shichida Y. 1997. A novel Go-mediated phototransduction cascade in scallop visual cells. J. Biol. Chem. 272, 22 979–22 982 10.1074/jbc.272.37.22979 (doi:10.1074/jbc.272.37.22979) - DOI - PubMed
-
- Koyanagi M, Takano K, Tsukamoto H, Ohtsu K, Tokunaga F, Terakita A. 2008. Jellyfish vision starts with cAMP signaling mediated by opsin-G(s) cascade. Proc. Natl Acad. Sci. USA 105, 15 576–15 580 10.1073/pnas.0806215105 (doi:10.1073/pnas.0806215105) - DOI - PMC - PubMed
-
- Scott K, Becker A, Sun Y, Hardy R, Zuker C. 1995. Gq alpha protein function in vivo: genetic dissection of its role in photoreceptor cell physiology. Neuron 15, 919–927 10.1016/0896-6273(95)90182-5 (doi:10.1016/0896-6273(95)90182-5) - DOI - PubMed
Publication types
MeSH terms
Substances
Grants and funding
LinkOut - more resources
Full Text Sources
Other Literature Sources
Molecular Biology Databases