

Trends in intakes and sources of solid fats and added sugars among U.S. children and adolescents: 1994-2010
- PMID: 23554397
- PMCID: PMC3713091
- DOI: 10.1111/j.2047-6310.2013.00156.x
Trends in intakes and sources of solid fats and added sugars among U.S. children and adolescents: 1994-2010
Abstract
Background: There are increasing global concerns about improving the dietary intakes of children and adolescents. In the United States (U.S.), the focus is on reducing energy from foods and beverages that provide empty calories from solid fats and added sugars (SoFAS).
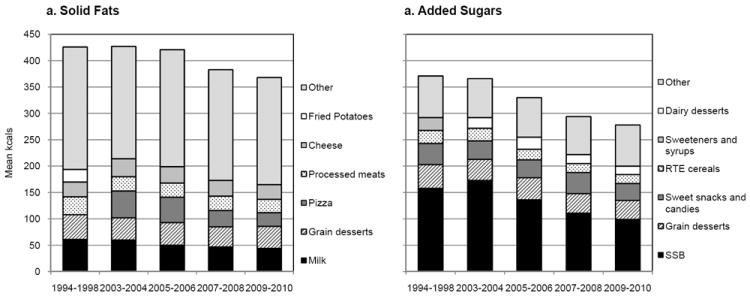
Objective: We examine trends in intakes and sources of solid fat and added sugars among U.S. 2-18 year olds from 1994 to 2010.
Methods: Data from five nationally representative surveys, the Continuing Survey of Food Intakes by Individuals Surveys (1994-1996) and the What We Eat In America, National Health and Nutrition Examination Surveys (2003-2004, 2005-2006, 2007-2008 and 2009-2010) were used to examine key food sources and energy from solid fats and added sugars. Sample sizes ranged from 2594 to 8259 per survey period, for a total of 17 268 observations across the five surveys. Food files were linked over time to create comparable food groups and nutrient values. Differences were examined by age, race/ethnicity and family income.
Results: Daily intake of energy from SoFAS among U.S. 2-18 year olds decreased from 1994 to 2010, with declines primarily detected in the recent time periods. Solid fats accounted for a greater proportion of total energy intake than did added sugars.
Conclusions: Although the consumption of solid fats and added sugars among children and adolescents in the U.S. decreased between 1994-1998 and 2009-2010, mean intakes continue to exceed recommended limits.
Keywords: Adolescent; United States; child; dietary intake.
© 2013 The Authors. Pediatric Obesity © 2013 International Association for the Study of Obesity.
Conflict of interest statement
None of the authors have conflict of interests of any type with respect to this manuscript.
Figures
References
-
- WHO. Global strategy on diet, physical activity and health. Geneva, Switzerland: 2004. - PubMed
-
- Pinhas-Hamiel O, Zeitler P. The global spread of type 2 diabetes mellitus in children and adolescents. J Pediatr. 2005;146:693–700. - PubMed
-
- Pinhas-Hamiel O, Zeitler P. Acute and chronic complications of type 2 diabetes mellitus in children and adolescents. Lancet. 2007;369:1823–31. - PubMed
-
- Urakami T, Suzuki J, Yoshida A, et al. Prevalence of components of the metabolic syndrome in schoolchildren with newly diagnosed type 2 diabetes mellitus. Pediatr Diabetes. 2009;10:508–12. - PubMed
Publication types
MeSH terms
Substances
Grants and funding
LinkOut - more resources
Full Text Sources
Other Literature Sources
Medical
