. 2013 Apr 3;33(14):5939-56.
doi: 10.1523/JNEUROSCI.3629-12.2013.

Multifeatural shape processing in rats engaged in invariant visual object recognition

Affiliations

Multifeatural shape processing in rats engaged in invariant visual object recognition

Alireza Alemi-Neissi et al. J Neurosci. .

Abstract

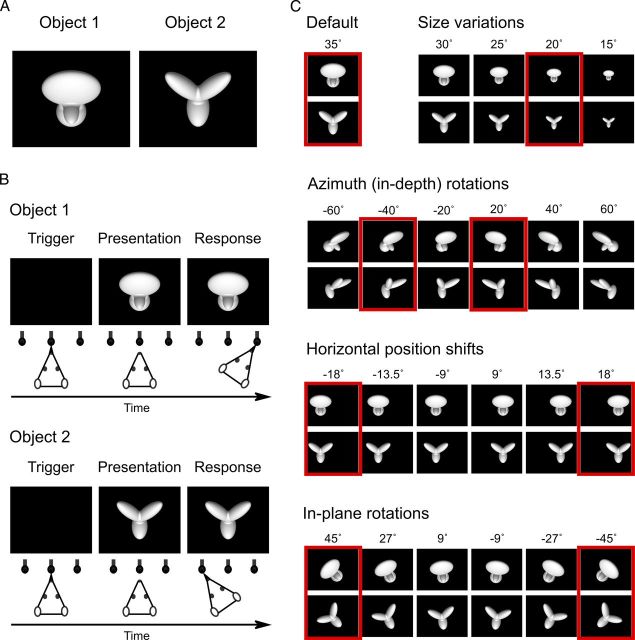
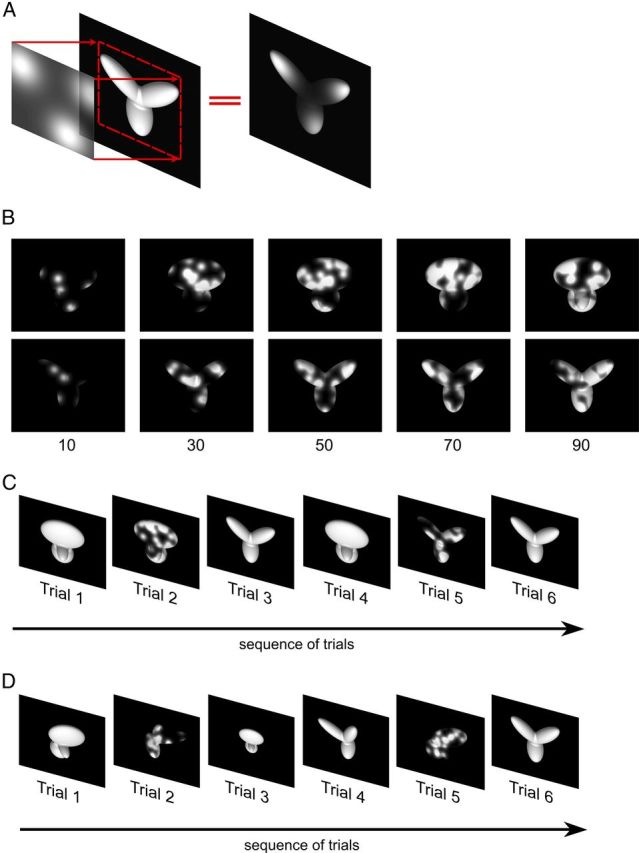
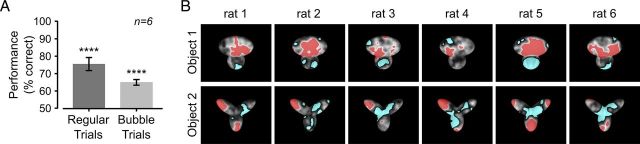
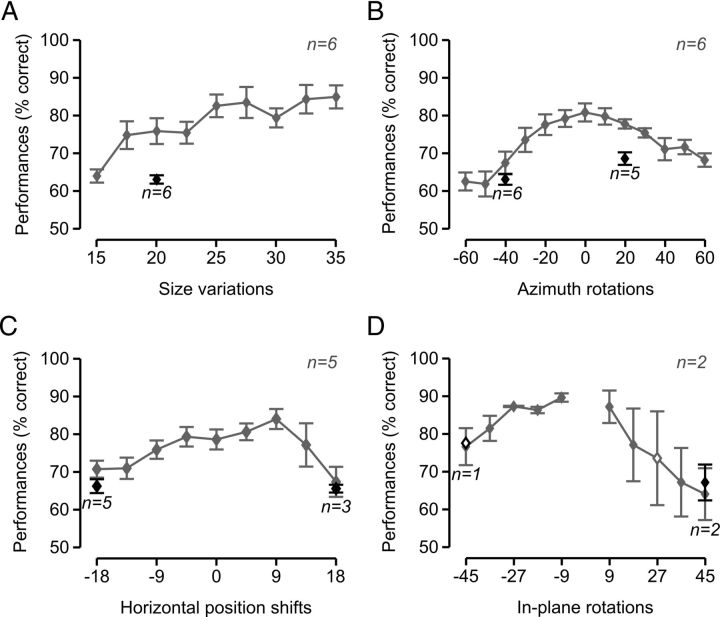
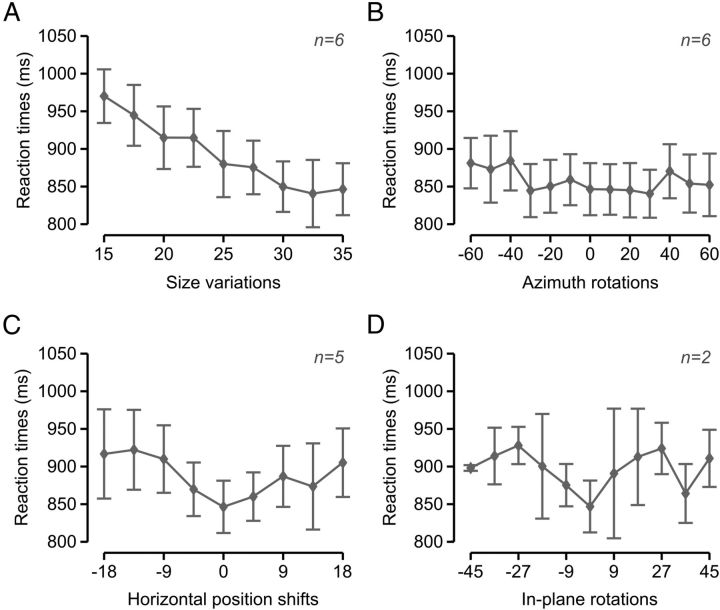
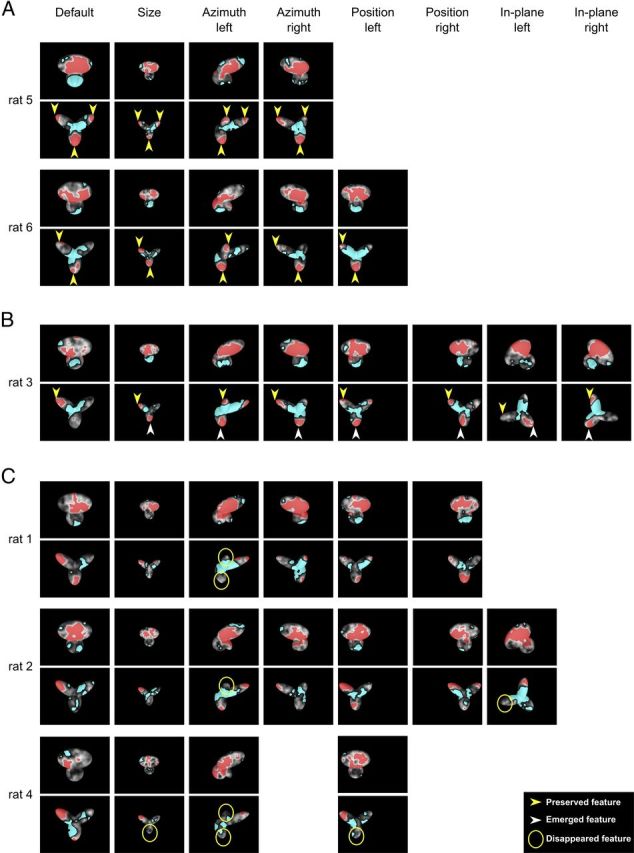
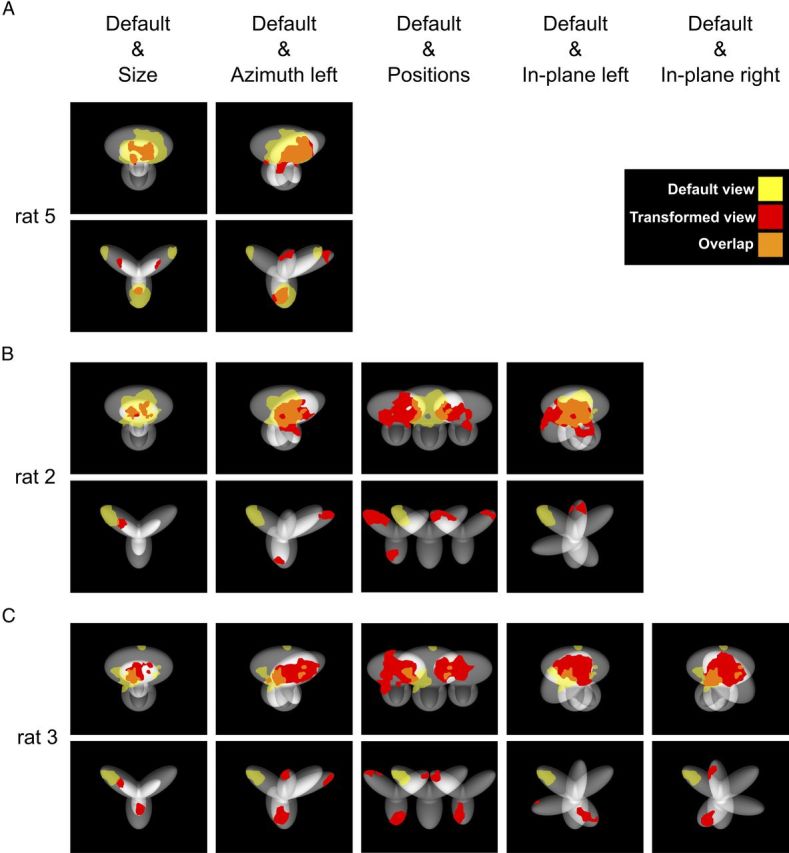
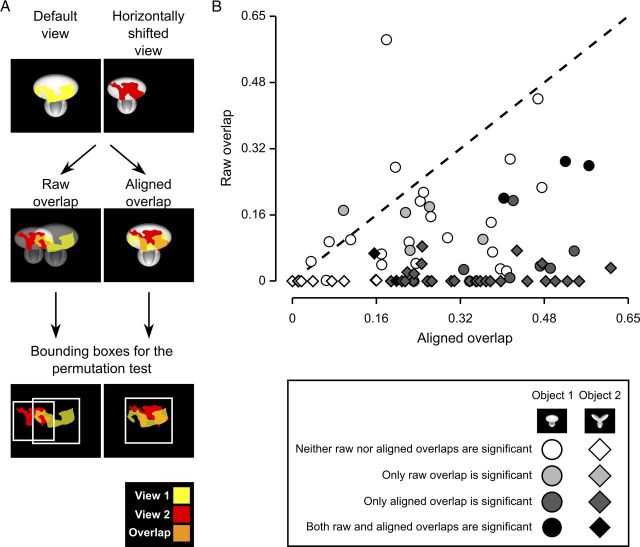
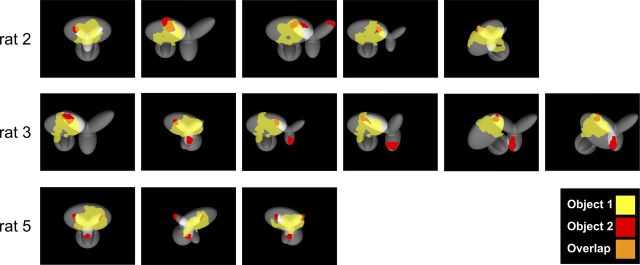
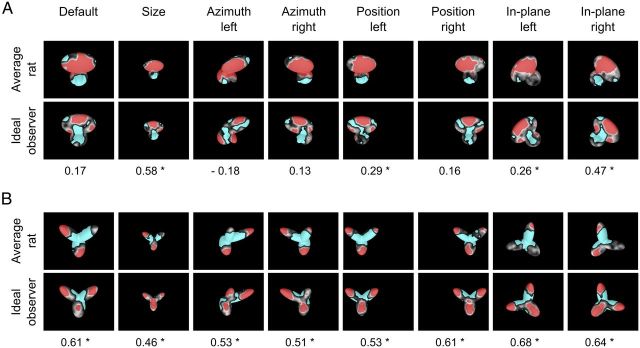
The ability to recognize objects despite substantial variation in their appearance (e.g., because of position or size changes) represents such a formidable computational feat that it is widely assumed to be unique to primates. Such an assumption has restricted the investigation of its neuronal underpinnings to primate studies, which allow only a limited range of experimental approaches. In recent years, the increasingly powerful array of optical and molecular tools that has become available in rodents has spurred a renewed interest for rodent models of visual functions. However, evidence of primate-like visual object processing in rodents is still very limited and controversial. Here we show that rats are capable of an advanced recognition strategy, which relies on extracting the most informative object features across the variety of viewing conditions the animals may face. Rat visual strategy was uncovered by applying an image masking method that revealed the features used by the animals to discriminate two objects across a range of sizes, positions, in-depth, and in-plane rotations. Noticeably, rat recognition relied on a combination of multiple features that were mostly preserved across the transformations the objects underwent, and largely overlapped with the features that a simulated ideal observer deemed optimal to accomplish the discrimination task. These results indicate that rats are able to process and efficiently use shape information, in a way that is largely tolerant to variation in object appearance. This suggests that their visual system may serve as a powerful model to study the neuronal substrates of object recognition.


Figures

Figure 1.
Figure 1.
Visual stimuli and behavioral task. A, Default views (0° in-depth and in-plane rotation) of the two objects that rats were trained to discriminate during Phase I of the study (each object default size was 35° of visual angle). B, Schematic of the object discrimination task. Rats were trained in an operant box that was equipped with an LCD monitor for stimulus presentation and an array of three sensors. The animals learned to trigger stimulus presentation by licking the central sensor and to associate each object identity to a specific reward port/sensor (right port for Object 1 and left port for Object 2). C, Some of the transformed views of the two objects that rats were required to recognize during Phase II of the study. Transformations included the following: (1) size changes; (2) azimuth in-depth rotations; (3) horizontal position shifts; and (4) in-plane rotations. Azimuth rotated and horizontally shifted objects were also scaled down to a size of 30° of visual angle; in-plane rotated objects were scaled down to a size of 32.5° of visual angle and shifted downward of 3.5°. Each variation axis was sampled more densely than shown in the figure: sizes were sampled in 2.5° steps; azimuth rotations in 5° steps; position shifts in 4.5° steps; and in-plane rotations in 9° steps. This yielded a total of 78 object views. The red frames highlight the subsets of object views that were tested in bubbles trials (Fig. 2).
Figure 2.
Figure 2.
The Bubbles method. A, Illustration of the Bubbles method, which consists of generating an opaque mask (fully black area) punctured by a number of randomly located transparent windows (i.e., the bubbles; shown as white, circular clouds) and then overlapping the mask to the image of a visual object, so that only parts of the object remain visible. B, Examples of the different degrees of occlusion of the default object views that were produced by varying the number of bubbles in the masks. C, Examples of trial types shown to the rats at the end of experimental Phase I. The object default views were presented both unmasked and masked in randomly interleaved trials (named, respectively, regular and bubbles trials). D, Examples of trial types shown during experimental Phase II, after the rats had learned to tolerate size and azimuth rotations. The animals were presented with interleaved regular and bubbles trials. The former included all possible unmasked object views to which the rats had been exposed up to that point (i.e., size and azimuth changes), whereas the latter included masked views of the −40° azimuth rotated objects.
Figure 3.
Figure 3.
Critical features underlying recognition of the default object views. A, Rat group average performance at discriminating the default object views was significantly lower in bubbles trials (light gray bar) than in regular trials (dark gray bar): p < 0.001 (one-tailed, paired t test). Both performances were significantly higher than chance: ****p < 0.0001 (one-tailed, unpaired t test). Error bars indicate SEM. B, For each rat, the saliency maps resulting from processing the bubbles trials collected for the default object views are shown as grayscale masks superimposed on the images of the objects. The brightness of each pixel indicates the likelihood, for an object view, to be correctly identified when that pixel was visible through the bubbles masks. Significantly salient and antisalient object regions (i.e., regions that were significantly positively or negatively correlated with correct identification of an object; p < 0.05; permutation test) are shown, respectively, in red and cyan.
Figure 4.
Figure 4.
Recognition performance of the transformed object views. Rat group average recognition performance over the four variation axes along which the objects were transformed. Gray and black symbols represent performances in, respectively, regular and bubbles trials that were collected over the course of the same testing sessions of experimental Phase II (see Materials and Methods). Solid and open symbols represent performances that were, respectively, significantly and nonsignificantly higher than chance: A–C, p < 0.0001 (one-tailed, unpaired t test); D, p < 0.05 (one-tailed, unpaired t test). Error bars indicate SEM.
Figure 5.
Figure 5.
RTs along the variation axes. Rat group average RTs over the four variation axes along which the objects were transformed. RTs were measured across all the sessions performed by each rat during experimental Phase II (see Materials and Methods) and then averaged across rats. Error bars indicate SEM. Panels AD refer to size variations (A), azimuth rotations (B), horizontal position shifts (C), and in-plane rotations (D).
Figure 6.
Figure 6.
Critical features underlying recognition of the transformed object views. For each rat, the saliency maps (with highlighted significantly salient and antisalient regions; same color code as in Fig. 3B) that were obtained for each transformed object view are shown. Maps obtained for different rats are grouped in different panels according to their stability across the tested views. A, For rats 5 and 6, the same pattern of salient features (i.e., lobes' tips) underlay recognition of all the views of Object 2 (see yellow arrows). B, For rat 3, one salient feature (i.e., the tip of the upper-left lobe) was preserved across all tested views of Object 2 (see yellow arrows), whereas a second feature (i.e., the tip of the bottom lobe) became salient after the animal started facing variation in object appearance (see white arrows). C, For rats 1, 2, and 4, features that underlay recognition of Object 2 's default view became no longer salient for some of the transformed views (see yellow circles) and were replaced by other salient features.
Figure 7.
Figure 7.
Overlap between the salient features obtained for different views of an object. Several pairs/triplets of views of Object 1 and Object 2 are shown superimposed, together with their salient features, to allow appreciating whether, and to what extent, such features overlapped. The salient features are the same as those shown in Figure 6, only here are shown in either yellow or red, to distinguish the features obtained, respectively, for the default and the transformed views. The orange patches indicate the overlap between the salient features of two different views in a pair/triplet. A, Rat 5. B, Rat 2. C, Rat 3.
Figure 8.
Figure 8.
Raw versus aligned features' overlap for all pairs of object views. A, Illustration of the procedure to compute the raw and aligned overlap between the salient features' patterns obtained for two different views of an object. The default and the leftward horizontally shifted views of Object 1 are used as examples (first row). To compute the raw features' overlap, these two object views (and the corresponding features' patterns) were simply superimposed (second row, left plot), as previously done in Figure 7. To compute the aligned features' overlap, the transformation that produced the leftward horizontally shifted view was reversed. That is, the object was shifted to the right of 18° and scaled back to 35°, so to perfectly overlap with the default view of the object itself (second row, right plot). In both cases, the overlap was computed as the ratio between the orange area and the sum of the red, yellow, and orange areas. The significance of the overlap was assessed by randomly shifting the salient regions of each object view within the minimum bounding box enclosing each view (see Results). Such bounding boxes are shown as white frames in the third row of the figure, for both the raw and aligned views. B, The raw features' overlap is plotted against the aligned features' overlap for each pair of views of Object 1 (circles) and Object 2 (diamonds) resulting from affine transformations (i.e., position/size changes and in-plane rotations). The shades of gray indicate whether the raw or/and the aligned overlap values were significantly larger than expected by chance (p < 0.05).
Figure 9.
Figure 9.
Overlap between the salient features obtained for exemplar views of Object 1 and Object 2. Several examples in which one or more salient features of Object 2 (red patches located at the tips of the upper and bottom lobes) overlapped with the salient feature located in the upper lobe of Object 1 (yellow patch). Overlapping regions are shown in orange.
Figure 10.
Figure 10.
Critical features' patterns obtained for the average rat and a simulated ideal observer. Rat group average saliency maps, with highlighted significantly salient (red) and antisalient (cyan) features (A, B, top rows), are compared with the saliency maps obtained for a linear ideal observer (A, B, bottom rows). For each object view, the Pearson correlation coefficient between the saliency maps obtained for the average rat and the ideal observer is reported below the corresponding maps. *p < 0.05, significant correlation (permutation test).

Similar articles

Cited by

References

    1. Andermann ML, Kerlin AM, Roumis DK, Glickfeld LL, Reid RC. Functional specialization of mouse higher visual cortical areas. Neuron. 2011;72:1025–1039. - PMC - PubMed
    1. Bonin V, Histed MH, Yurgenson S, Reid RC. Local diversity and fine-scale organization of receptive fields in mouse visual cortex. J Neurosci. 2011;31:18506–18521. - PMC - PubMed
    1. Busse L, Ayaz A, Dhruv NT, Katzner S, Saleem AB, Schölvinck ML, Zaharia AD, Carandini M. The detection of visual contrast in the behaving mouse. J Neurosci. 2011;31:11351–11361. - PMC - PubMed
    1. Chelazzi L, Rossi F, Tempia F, Ghirardi M, Strata P. Saccadic eye movements and gaze holding in the head-restrained pigmented rat. Eur J Neurosci. 1989;1:639–646. - PubMed
    1. DiCarlo JJ, Zoccolan D, Rust NC. How does the brain solve visual object recognition? Neuron. 2012;73:415–434. - PMC - PubMed

Publication types

LinkOut - more resources