. 2013 Apr 3;33(14):6001-11.
doi: 10.1523/JNEUROSCI.4225-12.2013.

Toward high performance, weakly invasive brain computer interfaces using selective visual attention

Affiliations

Toward high performance, weakly invasive brain computer interfaces using selective visual attention

David Rotermund et al. J Neurosci. .

Abstract

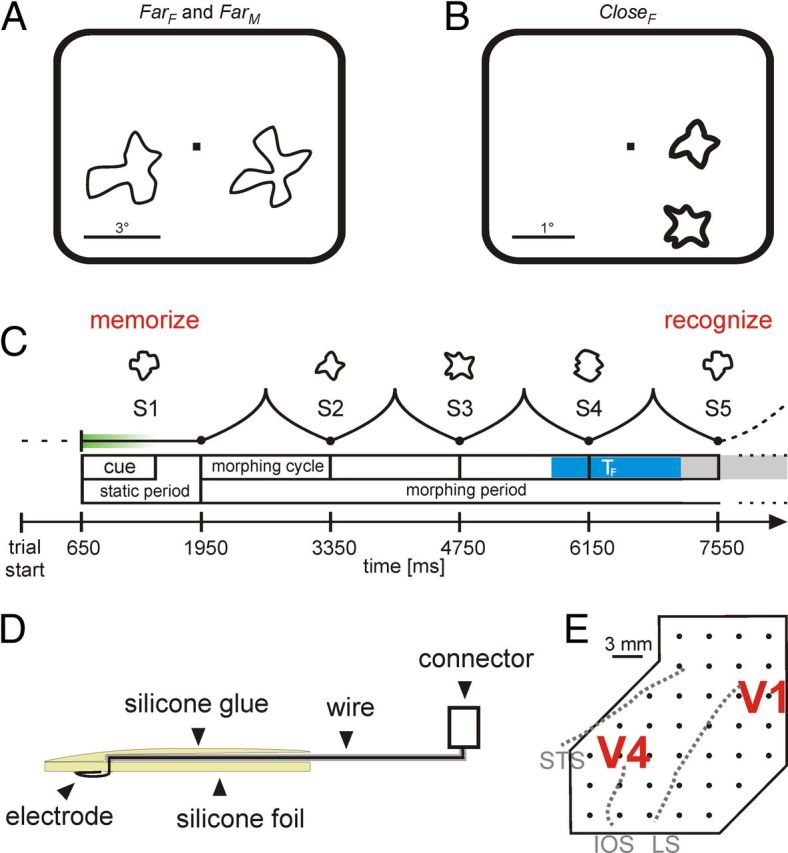
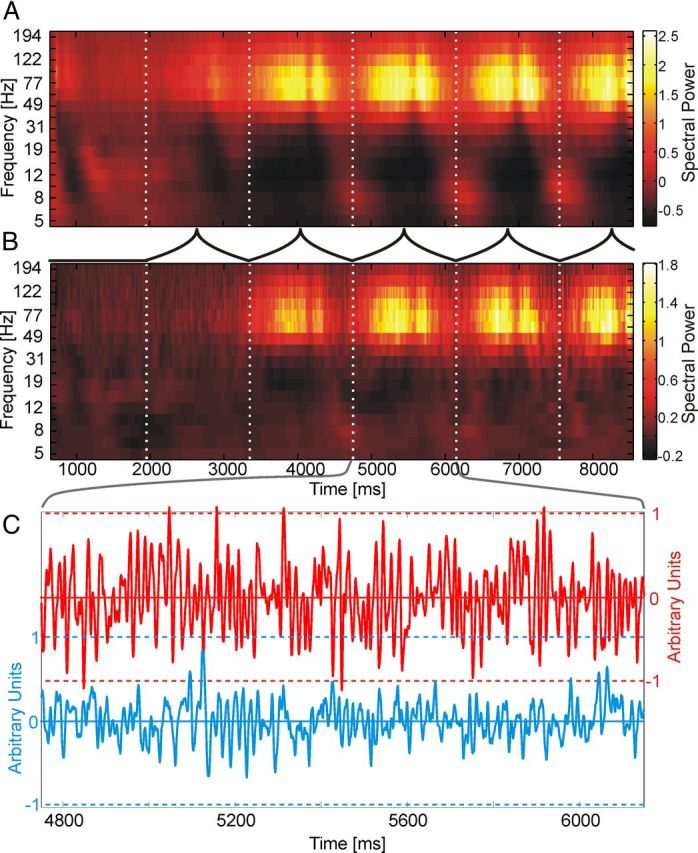
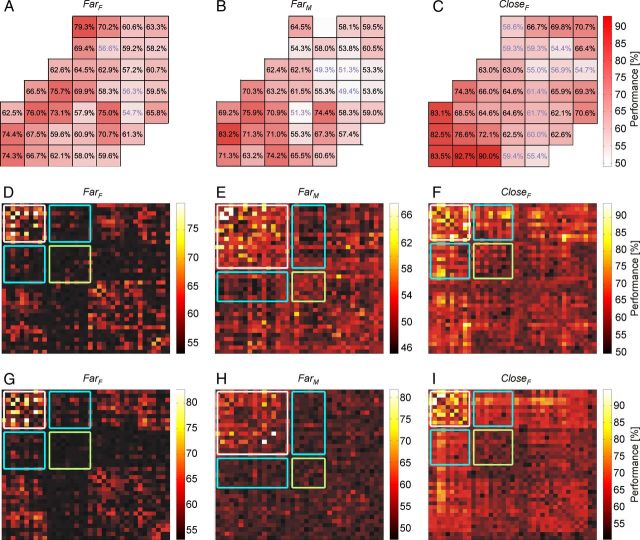
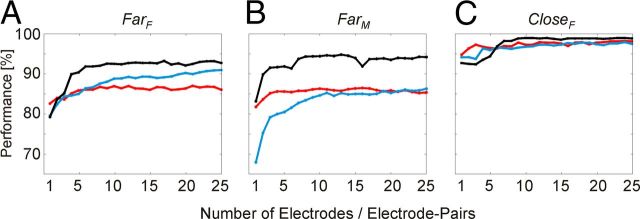
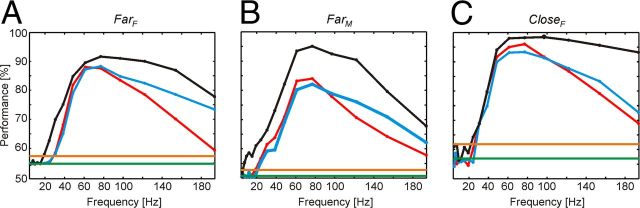
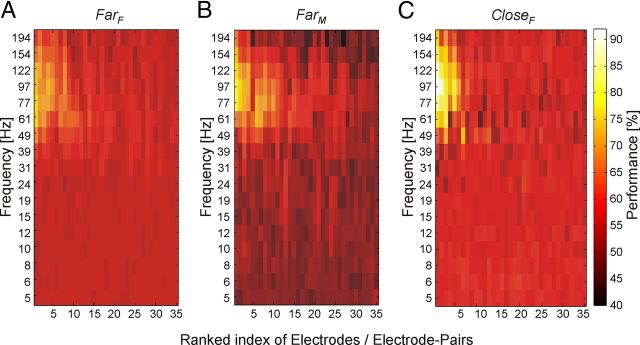
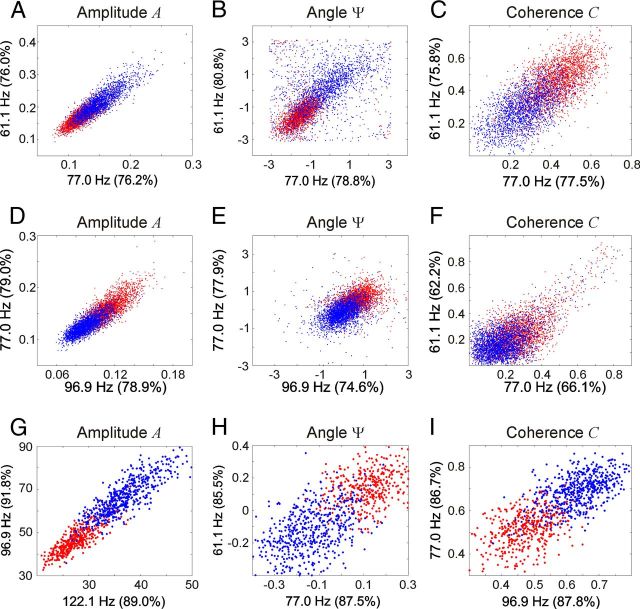
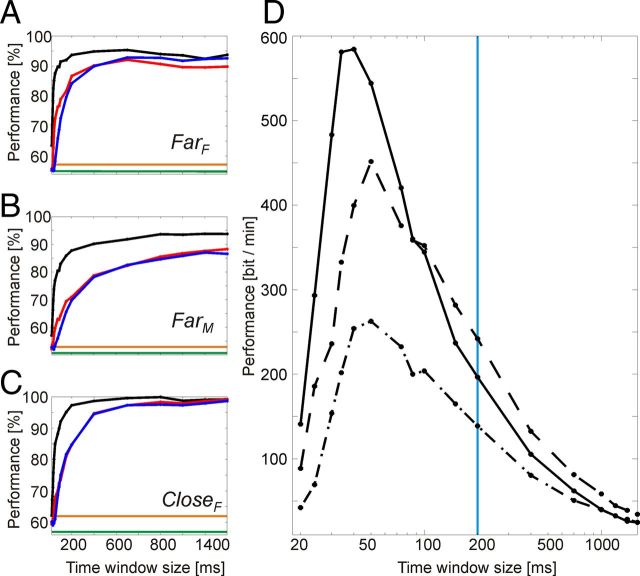
Brain-computer interfaces have been proposed as a solution for paralyzed persons to communicate and interact with their environment. However, the neural signals used for controlling such prostheses are often noisy and unreliable, resulting in a low performance of real-world applications. Here we propose neural signatures of selective visual attention in epidural recordings as a fast, reliable, and high-performance control signal for brain prostheses. We recorded epidural field potentials with chronically implanted electrode arrays from two macaque monkeys engaged in a shape-tracking task. For single trials, we classified the direction of attention to one of two visual stimuli based on spectral amplitude, coherence, and phase difference in time windows fixed relative to stimulus onset. Classification performances reached up to 99.9%, and the information about attentional states could be transferred at rates exceeding 580 bits/min. Good classification can already be achieved in time windows as short as 200 ms. The classification performance changed dynamically over the trial and modulated with the task's varying demands for attention. For all three signal features, the information about the direction of attention was contained in the γ-band. The most informative feature was spectral amplitude. Together, these findings establish a novel paradigm for constructing brain prostheses as, for example, virtual spelling boards, promising a major gain in performance and robustness for human brain-computer interfaces.


Figures

Figure 1.
Figure 1.
Experimental paradigm and recording. A, B, Size and position of the two morphing stimuli on the computer screen for the far (A) and the close condition (B). C, Time course of a trial with four morph cycles. Shown are only the shapes of the target sequence. Gray shading represents the response window for this trial, and the blue region represents the time window TF. D, Schematic drawing of a cross section of the array. E, Sketches of the position of the electrodes in relation to visual areas V1 and V4. STS, Superior temporal sulcus; IOS, inferior occipital sulcus; LS, lunate sulcus.
Figure 2.
Figure 2.
Basic LFP features. A, Time-frequency plot showing the average spectral power of one electrode over the time course of a trial, in condition FarF. Neuronal data were recorded over temporal cortex and showed the largest classification performance in dataset FarF. Spectral power (A2) was normalized to the baseline activity before stimulus onset via (A2/A2,baseline) − 1. B, Corresponding difference plot between the attentional conditions (attention inside the receptive field − attention outside the receptive field). C, Raw LFP data for the attention inside (red) and the attention outside the receptive field condition (blue). Gray lines between B and C indicate the morph cycle from which the data were taken.
Figure 3.
Figure 3.
Classification performance on data from single electrodes and single electrode pairs. A–C, Results for classification based on spectral amplitude A for the stimulus configurations: A, FarF; B, FarM; C, CloseF. Performance values that were not significant (i.e., p > 0.001) are shown in pale blue font. The color scale on the right represents classification performance. Classification performance based on phase coherence C (D–F) and panels based on phase difference Ψ (G–I), for all single electrode pairs in the stimulus configurations: D, G, FarF; E, H, FarM; F, I, CloseF. Performance is coded according to the color bar shown to the right of each panel. The white box represents T–T interactions; the green box, O–O interactions; and the cyan boxes, O–T interactions. All other interactions include electrodes over regions that were not driven by the stimuli. For all panels, 17 frequency bands between 5 and 200 Hz from the time interval TF were used.
Figure 4.
Figure 4.
Changes in classification performance with number of signals used. Classification on spectral amplitude A (black), on phase coherence C (blue), and on phase difference Ψ (red) is shown for all three datasets: A, FarF; B, FarM; C, CloseF. One to 25 electrodes (or electrode pairs) were subsequently included into the classification analysis, according to their rank defined by their single electrode (or electrode pair) classification performance. Again, datasets included all 17 frequency bands between 5 Hz and 200 Hz from time interval TF.
Figure 5.
Figure 5.
Discriminability of the attentional condition based on data from single frequency bands. Classification performance on spectral amplitude A (black, SetA), phase coherence C (blue, SetC), and phase difference (red, SetΨ), for the stimulus configurations: A, FarF; B, FarM; C, CloseF. All data were taken from the period TF. The green line represents the chance level; and the orange line represents the significance level with a p value of 0.001. Peak performance for all datasets and features was always between 60 and 80 Hz.
Figure 6.
Figure 6.
Discriminability of the attentional condition based on data from single frequency bands. The panels show classification performance on spectral amplitude A in dependence on frequency band and electrode (or electrode pair) index according to the color bar to the right, for the stimulus configurations: A, FarF; B, FarM; C, CloseF. Electrode(-pair)s are ordered according to descending performances. Differences of chance levels result in different background color levels in the plots. Classification performance for each frequency band is indicated in the corresponding axis label. All data were taken from the period TF.
Figure 7.
Figure 7.
Discriminability of the attentional condition based on data from single frequency bands. The graphs represent the data clouds for the two attentional conditions (in red and blue). The rows represent dataset FarF (A–C), dataset FarM (D–F), and dataset CloseF (G–I). The columns represent the features spectral amplitude A (A,D,G), phase difference Ψ (B,E,H), and phase coherence C (C,F,I). Each dot represents one trial. For the scatter plots, the two most informative frequency bands of the best electrode (or electrode pair) for the corresponding feature were selected. Classification performance for each frequency is indicated in the corresponding axis label. All data were taken from the period TF.
Figure 8.
Figure 8.
Classification performance in dependence on time window size. Results are displayed as percentage correct for the features “spectral amplitude” A (black), “phase difference” Ψ (red), and “phase coherence” C (blue) for the configurations: A, FarF; B, FarM; C, CloseF. Data from 25 electrodes (or electrode pairs) were used for the frequency bands between 30.6 and 193.6 Hz for time windows ≥200 ms width (i.e., 200, 400, 700, 1000, 1200, 1400, and 1600 ms). For window sizes <200 ms (i.e., 20, 24, 30, 34, 40, 50, 74, 86, 100, and 150 ms), only frequency bands for which the corresponding wavelets were fully fitting into the window were taken. D, Same data displayed as performance measured in bits per minute for the configurations: FarF (solid line), FarM (dashed-dotted line), and CloseF (dashed line), but only for spectral amplitude A. For all these plots, time windows ≥200 ms were stepped in 100 ms intervals, and time windows <200 ms were stepped with half their size. We analyzed data from a time interval starting 1700 ms before the beginning and ending 100 ms after the beginning of the response window. The mean response times in the three conditions were outside the analysis window (mean response time relative to the end of the analysis window: FarF, 171 ms; FarM, 290 ms; and CloseF, 198 ms). For all possible windows fitting within this time interval, the classification performances were calculated and their individual maxima for each window size is shown. D, The vertical blue line represents the border below it would not have been possible to achieve a continuous repositioning of the focus of attention within the used time window. The orange line represents the significance level (p < 0.001), and the green line represents the chance level.
Figure 9.
Figure 9.
Time courses of classification performance during the trial. Performance was computed for subsequent, 200 ms time windows whose centers are marked by the dots. The solid black line represents performance on spectral amplitude, and the dotted lines represent classification performance on feature combinations (black-red for A and phase difference Ψ, black-blue for A and phase coherence C, and red-blue for Ψ and C). The frequency bands between 30.6 and 193.6 Hz, and all temporal electrodes (or the corresponding electrode pairs) were used. The orange lines represent the significance level (p < 0.001), and the green lines represent the chance level. A, The origin of the time axis is centered at 1400 ms (one morph cycle, time course of cycle indicated below graph) before the behaviorally relevant stimulus (target) appeared. B, First morph cycle from shape S1 to shape S2, with time axis relative to trial onset. A, B, The blue shading represents the middle of a morph cycle.

References

    1. Andersen RA, Hwang EJ, Mulliken GH. Cognitive neural prosthetics. Annu Rev Psychol. 2010;61:169–190. - PMC - PubMed
    1. Blankertz B, Tangermann M, Vidaurre C, Fazli S, Sannelli C, Haufe S, Maeder C, Ramsey L, Sturm I, Curio G, Müller KR. The Berlin brain-computer interface: non-medical uses of BCI technology. Front Neurosci. 2010;4:198. - PMC - PubMed
    1. Blankertz B, Lemm S, Treder M, Haufe S, Müller KR. Single-trial analysis and classification of ERP components: a tutorial. Neuroimage. 2011;56:815–825. - PubMed
    1. Bour LJ, van Gisbergen JA, Bruijns J, Ottes FP. The double magnetic induction method for measuring eye movement-results in monkey and man. IEEE Trans Biomed Eng. 1984;31:419–427. - PubMed
    1. Brunner P, Ritaccio AL, Emrich JF, Bischof H, Schalk G. Rapid communication with a “P300” matrix speller using electrocorticographic signals (ECoG) Front Neurosci. 2011;5:5. - PMC - PubMed

Publication types

LinkOut - more resources