. 2013 Apr 3;33(14):6060-9.
doi: 10.1523/JNEUROSCI.5838-12.2013.

Millisecond stimulus onset-asynchrony enhances information about components in an odor mixture

Affiliations

Millisecond stimulus onset-asynchrony enhances information about components in an odor mixture

Jacob S Stierle et al. J Neurosci. .

Abstract

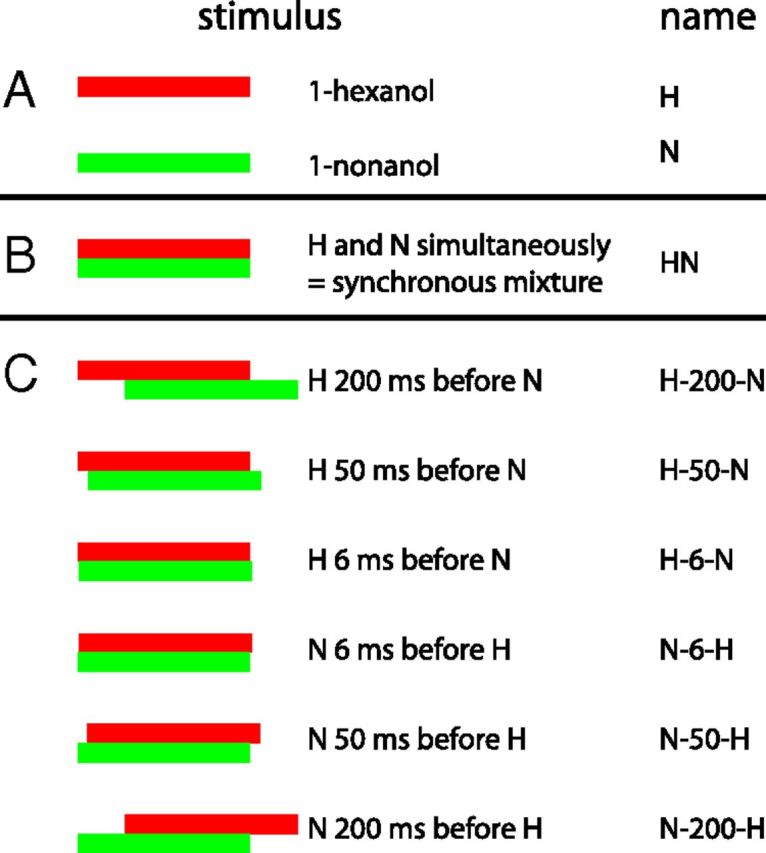
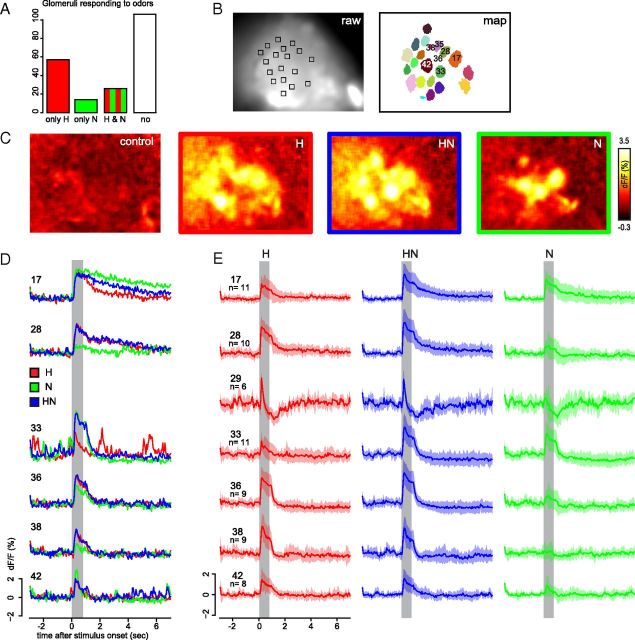
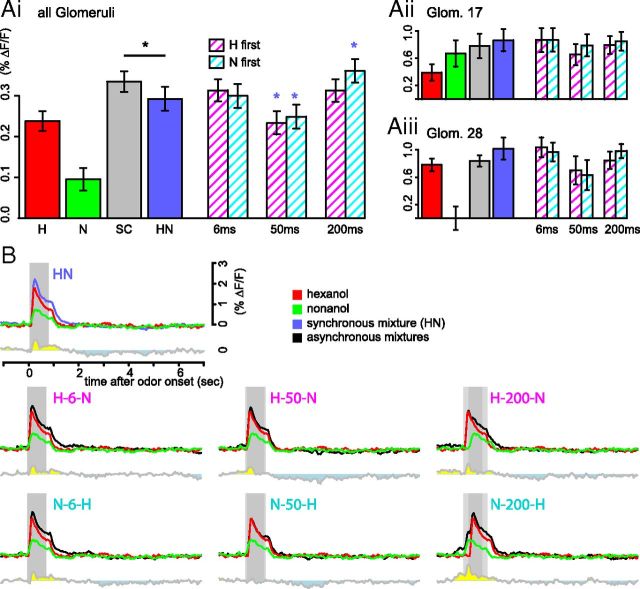
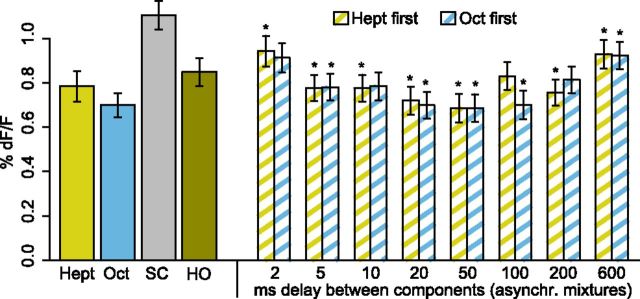
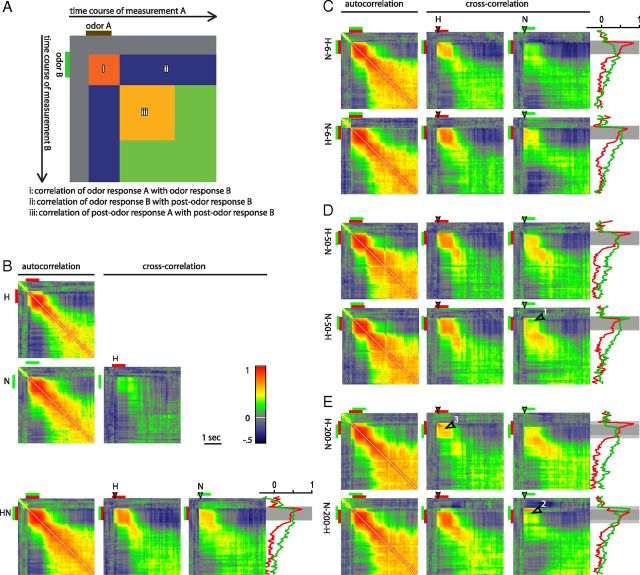
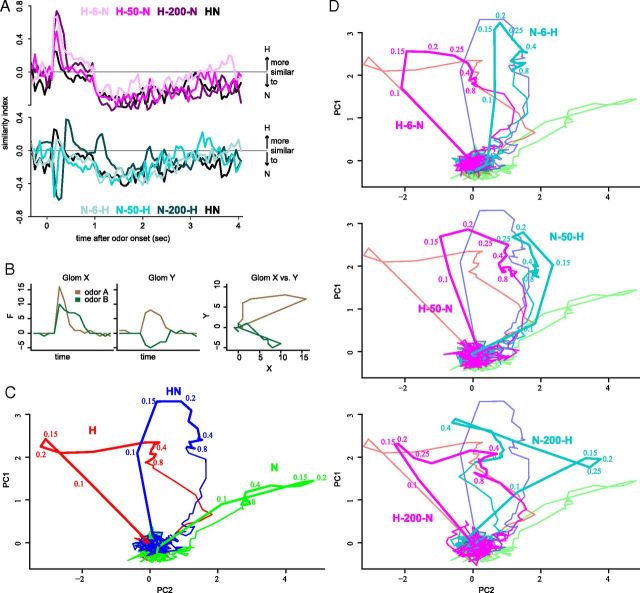
Airborne odorants rarely occur as pure, isolated stimuli. In a natural environment, odorants that intermingle from multiple sources create mixtures in which the onset and offset of odor components are asynchronous. Odor mixtures are known to elicit interactions in both behavioral and physiological responses, changing the perceptive quality of mixtures compared with the components. However, relevant odors need to be segregated from a distractive background. Honeybees (Apis mellifera) can use stimulus onset asynchrony of as little as 6 ms to segregate learned odor components within a mixture. Using in vivo calcium imaging of projection neurons in the honeybee, we studied neuronal mechanisms of odor-background segregation based on stimulus onset asynchrony in the antennal lobe. We found that asynchronous mixtures elicit response patterns that are different from their synchronous counterpart: the responses to asynchronous mixtures contain more information about the constituent components. With longer onset shifts, more features of the components were present in the mixture response patterns. Moreover, we found that the processing of asynchronous mixtures activated more inhibitory interactions than the processing of synchronous mixtures. This study provides evidence of neuronal mechanisms that underlie odor-object segregation on a timescale much faster than found for mammals.


Figures

Figure 1.
Figure 1.
Overview of the stimuli used in an experiment. Odorant pulses of 800 ms were given alone (A), together (B, synchronous mixture), or with a time delay between them (C, asynchronous mixtures).
Figure 2.
Figure 2.
Calcium signal from responses to hexanol (H), nonanol (N), and the synchronous mixture (HN). A, Number of glomeruli that responded either to H only, to N only, to both odors, or to neither of them. See Materials and Methods for the criteria after which a signal was considered as a response. B, Left: Example of a raw fluorescence snapshot of an AL at 488 nm excitation. Squares indicate regions of interest from which traces were extracted. Right: Glomerular map attained from the data movies by the algorithm described in Strauch et al. (2012). C, Color-coded images showing odor responses in an individual AL as relative calcium changes to mineral oil (control), the two components (H, N), and the synchronous mixture (HN). D, Response time courses of six glomeruli from the same individual AL as in B and C to the components and the synchronous mixture. Numbers indicate the identity of T1 glomeruli as described by Galizia et al. (1999). E, Response time courses of identified glomeruli averaged across animals. Traces show mean ± SD. Gray bars indicate the odor stimulus. We did not identify glomerulus T1–29 in the specimen shown in BD.
Figure 3.
Figure 3.
Asynchronous mixtures induce more inhibitory interactions than synchronous mixtures. Ai, Average PN response strengths during the 4 s after stimulus onset pooled over all measured glomeruli (bars show mean ± SEM, n = 203 glomeruli, 14 bees). The gray bars show the average response strengths to the stronger component, which corresponds to the minimum expected response strength to the mixture in the absence of mixture interaction. Repeated-measures ANOVA revealed significant differences between mixtures (F(6,202) = 7.43, p = 7.8 * 10−8). Blue asterisks denote significant differences from the synchronous mixture (Holm-Sidak post hoc test, global p < 0.05). Aii, Same analysis as in Ai, performed over glomeruli T1–T17, n = 11. Aiii, Same analysis as in Ai, performed over glomeruli T1–T28, n = 10. B, Average response traces of 203 glomeruli to the synchronous mixture (blue), the asynchronous mixtures (black), and their components hexanol (red) and octanol (green). Component traces were shifted according to their delay in the mixture. Bottom gray traces are the averaged, time-resolved difference between the mixture and the stronger component calculated on the level of subjects and then averaged. Times at which the response to the mixture is higher are marked yellow, times at which the response to the stronger component is higher are marked blue (indicating inhibitory mixture interaction).
Figure 4.
Figure 4.
Inhibitory mixture interactions are strongest at 50 ms asynchrony. Average response strengths (± SEM) of 171 glomeruli (different subjects as for H and N) during 4 s after stimulus onset to 2-heptanone (Hept), 1-octanol (Oct), and the synchronous (HO) and asynchronous mixtures. The gray bar shows the average response strengths to the stronger component. Repeated-measures ANOVA revealed significant differences between mixtures (F(16,170) = 13.172, p < 10−15). Asterisks denote significant difference of asynchronous mixtures to synchronous mixture. All mixtures were significantly lower than the stronger component (not indicated, Holm-Sidak post hoc test, global p < 0.05, corrected for multiple testing).
Figure 5.
Figure 5.
Cross-correlation matrices of glomerular response patterns of two stimuli. Every pixel gives a correlation value of two glomerular response patterns (vectors of length 203) for a certain time lag between two stimuli. A, Schematic of the cross-correlation between an odor A and an odor B explaining the meaning of the components in each cross-correlation image. B, Auto- and cross-correlation of the components and the synchronous mixture. N (green) indicates nonanol; H (red), hexanol. Time traces of the correlation values in the vertical line indicated by the filled arrowheads are shown at the side. Red indicates the correlation between the initial hexanol response and the mixture response; green, correlation between the initial nonanol response and the mixture response. CE, Autocorrelation and cross-correlation of the components and the asynchronous mixtures. Numbered arrowheads refer to effects described in the text.
Figure 6.
Figure 6.
The leading odor becomes more prominent in asynchronous mixtures. A, The similarity index, correlation[H vs mix] − correlation[N vs mix] for synchronous and asynchronous mixtures. Positive values indicate a higher correlation between H and a mixture; negative values indicate higher correlation between N and a mixture. Top: Similarity index for the synchronous mixture HN and for asynchronous mixtures that start with H. Bottom: Similarity index for HN and for asynchronous mixtures that start with N. The initial responses of asynchronous mixtures were more similar to the leading odor than to the trailing odor (same data as traces in Fig. 5). B, Principle of trajectory calculation for two glomeruli (fictive response time courses). C, D, Trajectories of the responses from 203 glomeruli for the components and the synchronous mixture (C) and for asynchronous mixtures with 6 ms (top), 50 ms (middle) und 200 ms (bottom), each with hexanol first (magenta) and nonanol first (cyan) (D). Plots contain the trajectories from C for comparison. Numbers next to trajectories indicate the time after stimulus onset in seconds. PC1 and PC2 explain 80% of the variance.

References

    1. Baker TC, Fadamiro HY, Cosse AA. Moth uses fine tuning for odour resolution [letter] Nature. 1998;393:530.
    1. Bronkhorst AW. The cocktail party phenomenon: a review of research on speech intelligibility in multiple-talker conditions. Acta Acustica united with Acustica. 2000;86:117–128.
    1. Broome BM, Jayaraman V, Laurent G. Encoding and decoding of overlapping odor sequences. Neuron. 2006;51:467–482. - PubMed
    1. Chandra S., Smith B. H. An analysis of synthetic processing of odor mixtures in the honeybee (Apis mellifera) J Exp Biol. 1998;201(Pt 22):3113–3121. - PubMed
    1. Coureaud G, Hamdani Y, Schaal B, Thomas-Danguin T. Elemental and configural processing of odour mixtures in the newborn rabbit. J Exp Biol. 2009;212:2525–2531. - PubMed

Publication types

LinkOut - more resources