. 2013 Apr 3;33(14):6081-92.
doi: 10.1523/JNEUROSCI.0035-13.2013.

Disruption of Arp2/3 results in asymmetric structural plasticity of dendritic spines and progressive synaptic and behavioral abnormalities

Affiliations

Disruption of Arp2/3 results in asymmetric structural plasticity of dendritic spines and progressive synaptic and behavioral abnormalities

Il Hwan Kim et al. J Neurosci. .

Abstract

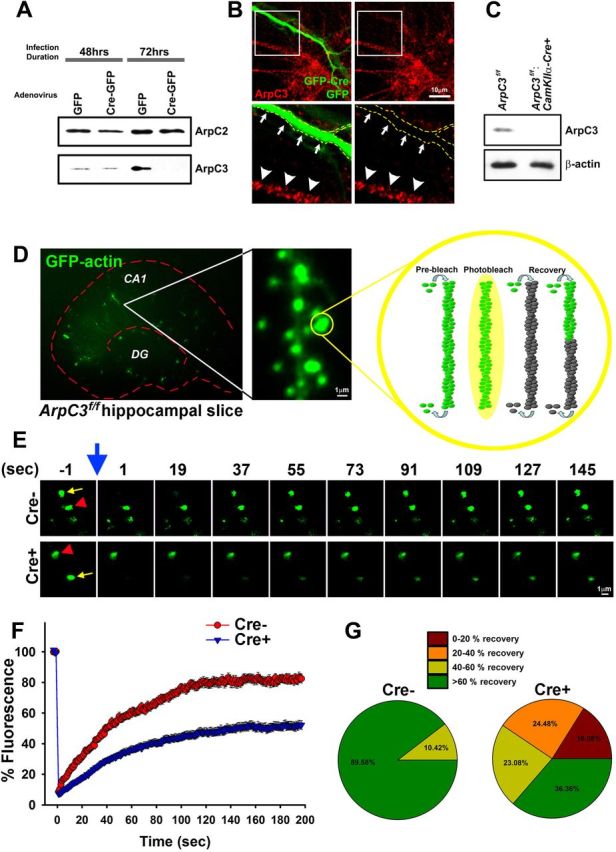
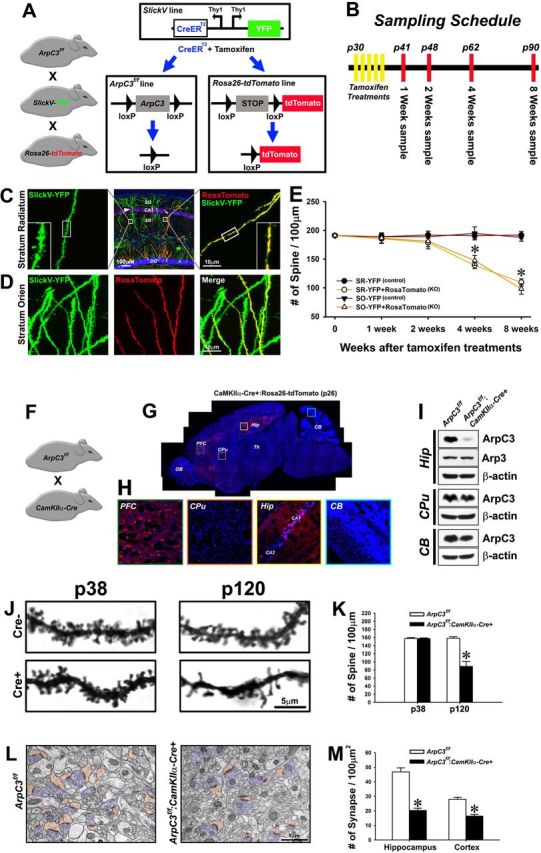
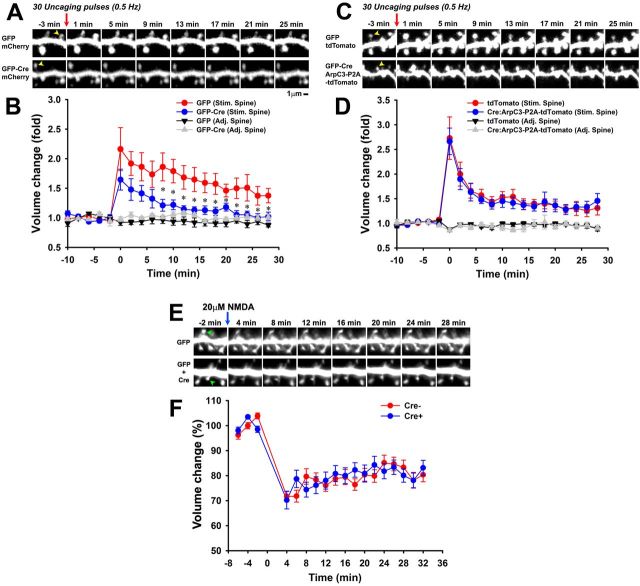
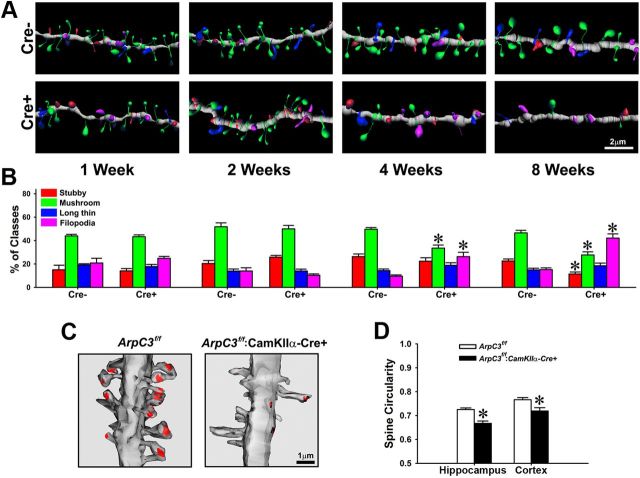
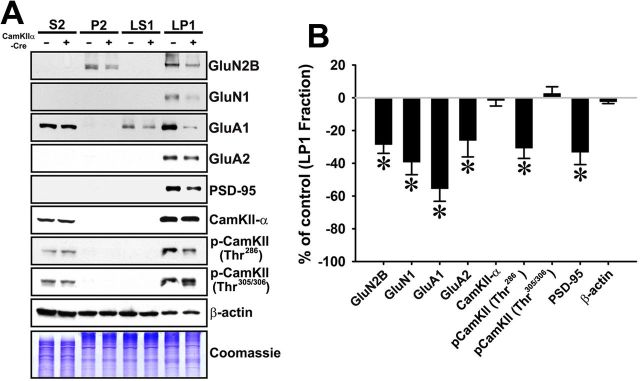
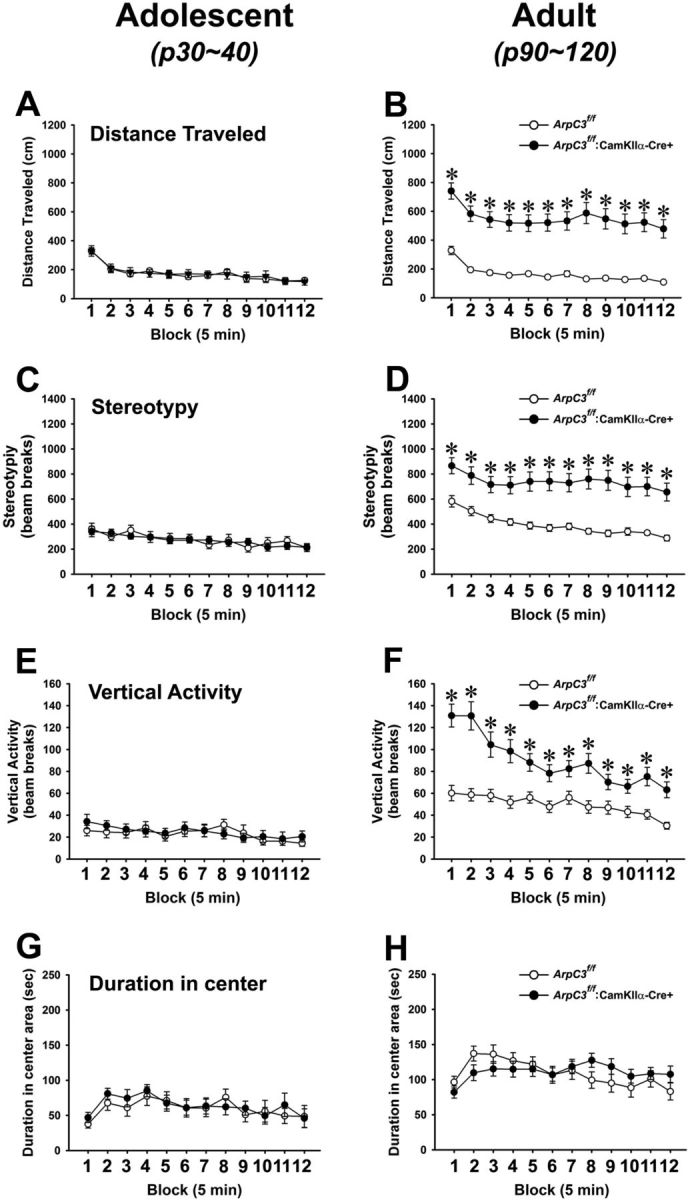
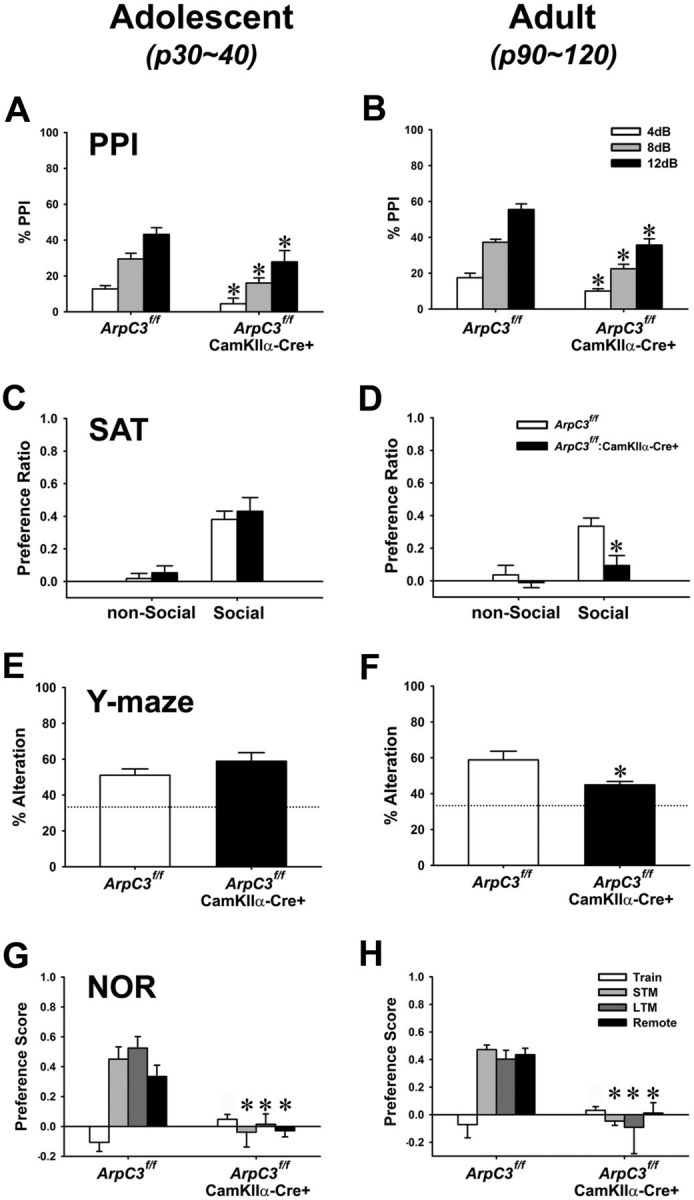
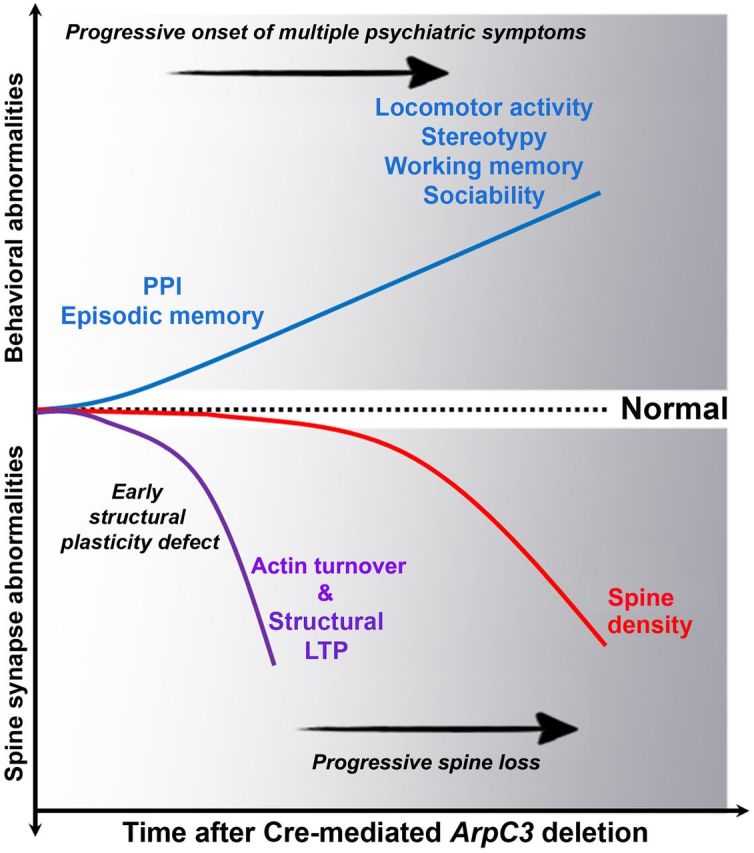
Despite evidence for a strong genetic contribution to several major psychiatric disorders, individual candidate genes account for only a small fraction of these disorders, leading to the suggestion that multigenetic pathways may be involved. Several known genetic risk factors for psychiatric disease are related to the regulation of actin polymerization, which plays a key role in synaptic plasticity. To gain insight into and test the possible pathogenetic role of this pathway, we designed a conditional knock-out of the Arp2/3 complex, a conserved final output for actin signaling pathways that orchestrates de novo actin polymerization. Here we report that postnatal loss of the Arp2/3 subunit ArpC3 in forebrain excitatory neurons leads to an asymmetric structural plasticity of dendritic spines, followed by a progressive loss of spine synapses. This progression of synaptic deficits corresponds with an evolution of distinct cognitive, psychomotor, and social disturbances as the mice age. Together, these results point to the dysfunction of actin signaling, specifically that which converges to regulate Arp2/3, as an important cellular pathway that may contribute to the etiology of complex psychiatric disorders.


Figures

Figure 1.
Figure 1.
Reduced spine actin dynamics upon loss of ArpC3. A, Mouse embryonic fibroblasts (MEFs) were cultured from e13.5 ArpC3f/f embryos and infected with either GFP or GFP-Cre adenovirus. Western blot analysis of lysates 48 and 72 h after infection confirmed the specific loss of ArpC3 at 72 h after infection (bottom), but not the related ArpC2 (top). B, Primary hippocampal neurons from ArpC3f/f mice were cultured and transfected with GFP-Cre or GFP (soluble fill). Seventy-two hours after transfection, neurons were immunostained for ArpC3 (red), which showed a punctate staining pattern within the cell body and neurites. GFP-Cre positive neuron (boxed region and outline) was negative for ArpC3 immunoreactivity. C, Synaptosomes purified from ArpC3f/f or ArpC3f/f:CaMKIIa-Cre mice were immunoblotted for ArpC3 (top) or β-actin as a loading control (bottom). D, Image of a hippocampal slice containing GFP-actin transfected neurons (left). GFP-actin is highly enriched in dendritic spines (middle). Schematic of photobleaching followed by recovery (right) illustrating that fluorescent recovery mainly depends on the turnover of existing actin filaments and reincorporation of freely-mobile unbleached GFP-actin monomers. E, Representative image montages of Cre− (top) and Cre+ (bottom panel) spines before and after (blue arrow) photobleaching (indicated by yellow arrows, unbleached spine is indicated by red arrowheads). F, Graph depicting average fluorescence recovery for Cre− and Cre+ spines. G, Average fraction of spines (last 30 s) that recover, binned by extent of recovery, from 0 to >60% recovery. Scale bars are indicated in each micrograph.
Figure 2.
Figure 2.
Progressive loss of dendritic spines upon ArpC3 deletion. A, Schematic of triple mutant ArpC3f/f:SlickV-YFP:Rosa26-lox-stop-lox-tdTomato mice. Induction of Cre activity with tamoxifen treatment induces deletion of ArpC3 and a lox-stop-lox cassette to label neurons that have lost ArpC3 with tdTomato. Neurons lacking Cre activity are only labeled with YFP. B, Timeline for experiments in the triple mutant mice showing the time-points for tamoxifen treatments and tissue collection. C, Representative confocal images showing YFP (control, left) and YFP + tdTomato (cKO, right) dendritic sections from the same tissue (middle; 8 weeks after tamoxifen). Regions of hippocampus are indicated; SO, stratum oriens; SR, stratum radiatum; DG, dentate gyrus. D, Representative confocal images of dendritic sections from stratum oriens, showing YFP (left), tdTomato (Cre-positive; middle), and merge (right), indicating the selective loss of spines in Cre-expressing neuron (8 weeks after tamoxifen). E, Graph of spine density 1–8 weeks after tamoxifen treatment for control (YFP) and cKO (YFP+tdTomato) neurons from CA1 stratum radiatum (SR; n = 11–15 neurons for each genotype and time-point) and stratum oriens (SO; n = 9–16 neurons for each genotype and time-point) hippocampal regions. Two-way ANOVA for the numbers of spines revealed a significant main effect of time after Cre induction (F(3,189) = 22.42, p < 0.001) and group (F(3,189) = 43.82, p < 0.001), and a significant time × group interaction (F(9,189) = 7.99, p < 0.001). Bonferroni-corrected pairwise comparisons noted that there were no significant differences in spine number among the four groups over the first 2 weeks after tamoxifen treatment. However, at 4 and 8 weeks the numbers of spines were significantly reduced in both SR and SO hippocampus in Cre+ neurons compared with those in Cre− control neurons (*p < 0.001, from respective controls). F, ArpC3f/f:CaMKIIa-Cre mouse line. G, Representative sagittal section from CaMKIIα-Cre:Rosa26-lox-stop-lox-tdTomato mouse at P26. tdTomato expression (red), a marker of Cre activity, and DAPI nuclear stain (blue) are shown. H, Boxed regions are expanded in G for the prefrontal cortex (PFC), caudate–putamen (CPu), hippocampal CA1 and CA2 (Hip), and cerebellum (CB) regions. OB, Olfactory bulb; Th, thalamus. I, Representative immunoblots from Cre+ (Hip) and Cre− regions (CPu, CB) for ArpC3, Arp3, and β-actin. Residual ArpC3 is likely to reflect Cre− hippocampal glia and interneurons. J, Visualization of spines from ArpC3f/f:CaMKIIa-Cre mice compared withArpC3f/f controls by Golgi stain at P38 and P120. K, Graph of spine density at P38 and P120. Independent t test showed no difference of spine density between cKO mice and littermate controls in P38 brains. However, P120 cKO mice showed a significant decrease of spine density compared with their littermate controls (t(1,4) = 6.71, p < 0.01), *p < 0.01, from controls at P120. L, Representative electron micrographs showing postsynaptic spines (orange) and presynaptic butons (blue) in control and cKO CA1 hippocampus at P120. M, Graph compares density of spine synapses in control and cKO sections from hippocampus [Cre− (n = 283 axospinous synapses from 29 micrographs); Cre+ (n = 196 axospinous synapses from 46 micrographs), and cortex [Cre− (n = 181 axospinous synapses from 31 micrographs); Cre+ (n = 113 axospinous synapses from 33 micrographs). *p < 0.001, from respective controls. Scale bars in each micrograph are indicated.
Figure 3.
Figure 3.
Asymmetric structural plasticity of spines by ArpC3 deletion. A, Representative time course images before and after glutamate uncaging showing control (top) and Cre-positive (bottom) spines. Time of uncaging is indicated above. Yellow arrowhead indicates stimulated spine. B, Graph depicting averaged time course of spine volume change in the same experiments as in A. ANOVA with repeated measure for four groups (stimulated GFP-expressing spines, adjacent GFP-expressing spines, stimulated GFP-Cre-expressing spines, and adjacent GFP-Cre-expressing spines) revealed a significant main effect of time-block (F(19,760) = 9.31, p < 0.001), group (F(3,40) = 12.35, p < 0.001), and significant time-block × group interaction effect (F(57,760) = 4.45, p < 0.001). Bonferroni-corrected pairwise comparisons noted that spine volume increases of KO neurons (stimulated GFP-Cre-expressing spines) were significantly lower than those of control neurons (stimulated GFP-expressing spines) from the 10th time-block (8 min after stimulation) (*p<0.05). C, Representative images showing control (top) and ArpC3 rescued (bottom) spines. Time of uncaging is indicated above. Yellow arrowhead indicates stimulated spine. D, Graph depicting averaged time course of spine volume change in the same experiments as in C. No differences in stimulated control and rescued spines are seen. E, Representative time course images before and after 20 μm NMDA treatment showing control (top) and Cre-positive (bottom) spines. Green arrowheads indicate spines showing marked volume loss. F, Graph depicting averaged time course of spine volume change in the same experiments as in E. No differences between Cre− control and Cre+ spines are seen.
Figure 4.
Figure 4.
Altered spine morphology in ArpC3 cKO neurons. A, Reconstructed images from control (Cre−) and cKO (Cre+) dendrites 1–8 weeks after tamoxifen treatment from ArpC3f/f:SlickV-YFP:Rosa26-lox-stop-lox-tdTomato neurons. Morphology of individual spines is color-coded according to the key in B. B, Graph depicting the percentage of each morphological class of spine over time after tamoxifen-mediated Cre induction. ANOVA with repeated measure revealed significant main effects of spine-type (F(3,288) = 178.7, p < 0.001), spine-type × genotype (F(3,288) = 21.375, p < 0.001), spine-type × time (F(9,288) = 10.76, p < 0.001), and spine-type × genotype × time (F(9,288) = 8.18, p < 0.001). However, an interaction between genotype × time was not detected. Bonferroni-corrected pairwise comparisons noted that there were no significant differences in spine classes between genotypes over the first 2 weeks after tamoxifen treatment. However, at 4 weeks, mushroom-shaped spines in YFP+tdTomato double positive KO neurons were selectively decreased, whereas, filopodia-like spines were significantly increased compared with YFP single positive control neurons (*p < 0.001). At 8 weeks after tamoxifen treatment, stubby and mushroom spines in YFP+tdTomato double positive KO neurons were significantly decreased, whereas, filopodia-like spines were significantly increased compared with YFP single positive control neurons (*p < 0.001). n = 13–15 neurons per genotype were used for each time-point. C, Three-dimensional EM reconstructions of hippocampal dendrites from ArpC3f/f (control, left) and ArpC3f/f:CaMKIIα-Cre (cKO, right) mice showing representative differences in overall spine morphology and density. Postsynaptic density (PSD) is indicated in red. D, Graph depicting the spine head circularity computed from electron micrographs from control ArpC3f/f and cKO ArpC3f/f:CaMKIIα-Cre mice; 1.0 corresponds to a perfect circle. Hippocampus (n = 283 for ArpC3f/f control, n = 196 for ArpC3f/f:CaMKIIα-Cre, *p < 0.001, from control). Cerebral cortex (n = 181 for ArpC3f/f control, n = 113 for ArpC3f/f:CaMKIIα-Cre, *p < 0.01, from control. Scale bars in each micrograph are indicated.
Figure 5.
Figure 5.
Reduced glutamate receptors and CamKll activation in PSD of ArpC3f/f:CaMKIIα-Cre mice. A, Representative immunoblots of subcellular fractions from ArpC3f/f (Cre−; n = 6) and ArpC3f/f:CaMKIIα-Cre (Cre+; n = 6) adult mice at P120. Antibodies used in each panel are indicated on the right. Bottom panel is a representative Coomassie-stained gel showing equivalent total protein loading for each fraction. S2, Cytosol; P2, crude synaptosome; LS1, synaptosomal cytosol; LP1, synaptosomal membrane. B, Graph of levels of each PSD component in LP1 fraction as a percentage of control, quantified from immunoblots in A. Independent t test revealed significant reductions of GluN2B (t(1,10) = 5.82, p < 0.001), GluN1 (t(1,10) = 5.57, p < 0.001), GluA1 (t(1,10) = 7.83, p < 0.001), GluA2 (t(1,10) = 2.85, p < 0.05), p-CamKllT286 (t(1,10) = 5.32, p < 0.001), PSD-95 (t(1,10) = 4.84, p < 0.001) in adult (P120) ArpC3f/f:CaMKIIa-Cre mice compared with those of littermate controls. However, total CamKllα, p-CamKllT305/306, and β-actin levels did not show any significant difference between cKO mice and controls.
Figure 6.
Figure 6.
Analyses of open field behaviors in young and adult ArpC3f/f:CaMKIIα-Cre mice. Analysis of behaviors of control ArpC3f/f and ArpC3f/f:CaMKIIα-Cre mice at P30–P40 (A, C, E, G) and at P90–P120 (B, D, F, H). A, B, Distance traveled in the open field test (OFT) over 1 h in control and ArpC3 cKO mice (adolescent n = 15 control, n = 13 cKO; adult n = 37 control, n = 43 cKO). Hyperactivity was increased only in adult cKO mice. ANOVA with repeated measure for activity levels of four groups (genotypes of both adolescent and adult) revealed significant main effects of time-block (F(11,1144) = 19.70, p < 0.001) and group (F(3,104) = 21.57, p < 0.001), but no time-block × group interaction. Bonferroni corrected pairwise comparisons revealed that activity levels of cKO mice were significantly higher than that of adolescent mice (both controls and cKOs) and adult littermate controls throughout all time points (*p < 0.001). C, D, Stereotypical behavior as quantified by the number of repeated beam-breaks <1 s in the open field. ANOVA with repeated measure for four groups revealed significant main effect of group (F(3,104) = 16.44, p < 0.001), but no time-block × group interaction. Bonferroni-corrected pairwise comparisons revealed no differences between adolescent control (ArpC3f/f) and cKO (ArpC3f/f:CaMKIIaCre) mice (C). However, the level of stereotypic behaviors of cKO mice were significantly higher than that of adolescent mice (both controls and cKOs) and adult littermate controls throughout all time points (D) (*p < 0.001). E, F, Rearing behaviors in the open field as determined by the numbers of vertical beam-breaks for adolescent mice (left) and adult (right) mice. ANOVA with repeated measure of four groups revealed significant main effect of group (F(3,104) = 21.23, p < 0.001), and significant time-block × group interaction effect (F(33,1144) = 4.38, p < 0.001). Bonferroni corrected pairwise comparisons revealed no differences between adolescent control and cKO mice (E). However, the levels of vertical activity of cKO mice were significantly higher than that of adolescent mice (both controls and cKOs) and adult littermate controls throughout all time points (F) (*p < 0.05). G, H, Durations in center area of open field were not significantly different between control and cKO mice both at adolescent (G) and adult ages (H).
Figure 7.
Figure 7.
Analyses of PPI, sociability, working memory, and episodic memory in young and adult ArpC3f/f:CaMKIIα-Cre mice. A, B, Percentage PPI of acoustic startle responses at 4, 8, and 12 dB prepulses (over a 64 dB white noise background) (adolescent n = 15 control, n = 10 cKO; adult n = 9 control, n = 9 cKO). ANOVA with repeated measure revealed significant main effects of test-phase (4–12 dB) (F(2,42) = 34.17, p < 0.001 for adolescent mice; F(2,32) = 81.33, p < 0.001 for adults) and genotype (F(1,21) = 11.95, p < 0.01 for adolescent mice; F(1,16) = 31.67, p < 0.001 for adults), but no test-phase × genotype interactions. Bonferroni-corrected pairwise comparisons noted that the PPI of mutants against all three prepulse levels (4, 8, and 12 dB) were decreased in both adolescent and adult mice compared with their littermate controls (*p < 0.05). C, D, Preference ratio for nonsocial or social stimuli in the social affiliation test (SAT) (adolescent n = 13 control, n = 13 cKO; adult n = 13 control, n = 12 cKO). C, For adolescent mice, ANOVA with repeated measure revealed a significant main effects of test-phase (F(1,23) = 48.71, p < 0.001). However, there was no genotype effect (F(1,23) = 0.632, p = 0.43), nor test-phase × genotype interaction. D, For adult mice, ANOVA with repeated measure noted significant main effects of test-phase (F(1,20) = 6.54, p < 0.05) and genotype effect (F(1,20) = 14.38, p < 0.001), whereas no significant test-phase × genotype interaction was detected. Bonferroni comparisons showed that the social interactions of adult mutants with the stimulus mouse was decreased compared with littermate controls (*p < 0.001). E, F, Y-maze test of working memory showing the average of percentage correct alternations. Dotted line indicates percentage alternations expected by chance (33%) (adolescent n = 14 control, n = 13 cKO; adult n = 9 control, n = 9 cKO). Independent t test revealed that the correct alteration rate of adolescent mutant mice was not different from littermate controls (E) (t(1,25) = 1.39, p = 0.177), whereas adult mutants showed a significantly decreased correct alteration rate compared with their controls (F) (t(1,16) = 2.52, p < 0.05). G, H, Novel object recognition (NOR) test of short-term (STM), long-term (LTM), and remote memory. The preference score for the novel object is shown (adolescent n = 14 control, n = 13 cKO; adult n = 9 control, n = 9 cKO). ANOVA with repeated measure revealed significant main effects of test-phase (F(3,75) = 5.59, p < 0.01 for adolescent mice; F(3,42) = 3.53, p < 0.05 for adults), genotype (F(1,25) = 64.91, p < 0.001 for adolescent mice; F(1,14) = 23.59, p < 0.01 for adults), and significant test-phase × genotype interaction effect (F(3,75) = 19.15, p < 0.001 for adolescent mice; F(3,42) = 7.14, p < 0.001 for adults). Bonferroni-corrected pairwise comparisons noted that adolescent cKO mice have deficits in all three types of memory capability (short-, long-term, and remote memory) compared with those of littermate controls (*p < 0.05).
Figure 8.
Figure 8.
Schematic model summarizing the progressive development of synaptic and behavioral abnormalities following ArpC3 deletion. Loss of ArpC3 in postnatal excitatory neurons of forebrain results in two phases of progressive synaptic abnormalities; an early impairments of actin turnover and structural plasticity of spines (purple line), followed by a second phase of gradual loss of spine synapses (red line). Each phase is associated with a distinct progression of multiple behaviors related to psychiatric disorders (blue line). Dotted line indicates normal range.

References

    1. Addington AM, Rapoport JL. The genetics of childhood-onset schizophrenia: when madness strikes the prepubescent. Curr Psychiatry Rep. 2009;11:156–161. - PMC - PubMed
    1. Allen KM, Gleeson JG, Bagrodia S, Partington MW, MacMillan JC, Cerione RA, Mulley JC, Walsh CA. PAK3 mutation in nonsyndromic X-linked mental retardation. Nat Genet. 1998;20:25–30. - PubMed
    1. Arguello PA, Gogos JA. Modeling madness in mice: one piece at a time. Neuron. 2006;52:179–196. - PubMed
    1. Barros CS, Calabrese B, Chamero P, Roberts AJ, Korzus E, Lloyd K, Stowers L, Mayford M, Halpain S, Müller U. Impaired maturation of dendritic spines without disorganization of cortical cell layers in mice lacking NRG1/ErbB signaling in the central nervous system. Proc Natl Acad Sci U S A. 2009;106:4507–4512. - PMC - PubMed
    1. Bennett MR. Schizophrenia: susceptibility genes, dendritic-spine pathology and gray matter loss. Prog Neurobiol. 2011;95:275–300. - PubMed

Publication types

MeSH terms