. 2013;11(3):e1001508.
doi: 10.1371/journal.pbio.1001508. Epub 2013 Mar 12.

Positively charged residues are the major determinants of ribosomal velocity

Affiliations

Positively charged residues are the major determinants of ribosomal velocity

Catherine A Charneski et al. PLoS Biol. 2013.

Abstract

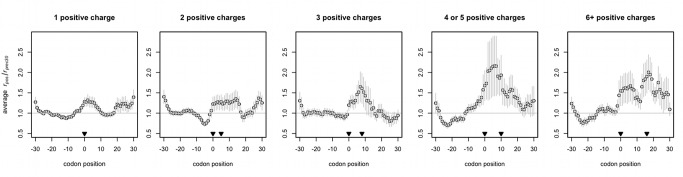
Both for understanding mechanisms of disease and for the design of transgenes, it is important to understand the determinants of ribosome velocity, as changes in the rate of translation are important for protein folding, error attenuation, and localization. While there is great variation in ribosomal occupancy along even a single transcript, what determines a ribosome's occupancy is unclear. We examine this issue using data from a ribosomal footprinting assay in yeast. While codon usage is classically considered a major determinant, we find no evidence for this. By contrast, we find that positively charged amino acids greatly retard ribosomes downstream from where they are encoded, consistent with the suggestion that positively charged residues interact with the negatively charged ribosomal exit tunnel. Such slowing is independent of and greater than the average effect owing to mRNA folding. The effect of charged amino acids is additive, with ribosomal occupancy well-predicted by a linear fit to the density of positively charged residues. We thus expect that a translated poly-A tail, encoding for positively charged lysines regardless of the reading frame, would act as a sandtrap for the ribosome, consistent with experimental data.


Conflict of interest statement

The authors have declared that no competing interests exist.

Figures

Figure 1
Figure 1. Visual overview of our plotting analyses.
A feature of one codon encoding a positive charge as a potential slower of translation elongation is considered as an example. The feature of interest (here the encoded charge) must be surrounded by no other codons encoding positive charges for 30 codons in both directions so as to not interfere with our measurement of slowing due to the single encoded charge we have identified. (A) We start with footprint data, which we have stringently mapped to the codons surrounding the encoded positive charge of interest on the mRNA in which the encoded charge resides. We first count the ribosomal footprints mapping to each codon position in this area. We take the average of the ribosomal footprint counts among the 30 codons preceding (the start of) the feature. We consider the average footprint counts of these preceding 30 codons (rprec30) to reflect the baseline speed at which ribosomes are translating before they reach the encoded charge. We then divide the ribosomal footprint counts in each of the 61 codon positions in this section of the mRNA by rprec30 to measure whether they are more densely or sparsely covered with ribosomal footprints in a given codon position relative to the density before the feature. Note the ratios prior to x = 0 will tend to center around 1 as they will have been normalized by a value likely close to their own. We calculate these relative ratios separately for every feature cluster in every mRNA we identify as suitable for our analysis. (B) To ask whether there is a trend in slowing upon the translation of the feature of interest (the single positive charge in this example), we align all of the mRNAs with the feature of interest by (the start of) the feature. We determine the average relative change in ribosomal density upon translation of the feature by averaging each of the ratios calculated in (A) for each aligned codon surrounding the feature. It is these mean ratios we consider when we calculate the slowing effect (if any) of a given feature. The degree of slowing due to a feature is a function of both the magnitude of the footprint buildup on any one codon as well as the length along the mRNA that the buildup extends. We hence calculate the slowing due to the feature (here the single positive charge) by summing the area between the line y = 1, which represents the baseline speed (see A) and the mean relative ratios between the start of the feature at x = 0 and the point where the means cross y = 1 again (highlighted purple area). If the line does not intersect with y = 1 again by the end of the window (x = 30), the entire area under the curve from x = 0 to x = 30 was used. We do not consider codons at x>30 as there may be positive charges encoded in this downstream region that we do not wish to interfere with our measurements. In some cases, not slowing but speeding will occur, indicated by ratios that are less than 1 (not shown). In this case, we calculate the degree of speeding similarly, by summing the area between the mean ratios and y = 1.
Figure 2
Figure 2. Clusters of rare codons do not tend to slow ribosomes.
The first of the number of nonoptimal codons indicated always occurs at x = 0, and the rest, if any, may be found at points up to and including the codon indicated by the second arrowhead. The mean rpos/rprec30, or relative change in ribosomal occupancy, at each position across aligned transcripts ± s.e.m. is plotted. The horizontal at y = 1 represents the null expectation that positive charges do not alter ribosomal speed—that is, that ribosomes are, on average, as frequently present before the rare codon cluster as after it. The three-rare codon plot in (B) is plotted with different axes as it is an outlier. Some residual slowing is observed near x = −30 on all plots due to slowing elements (e.g., positive charges) that may be encoded just upstream (x<−30). (A) All genes with rare codon clusters. (B) Genes with rare codon clusters that have 0 or 1 positive charges coded for in the last 30 codon positions plotted. These plots represent the net effect of tAI on ribosomal density, with the bulk of the effect of positive charge removed. (C) Genes with rare codon clusters that have two or more positive charges in the last 30 codon positions plotted.
Figure 3
Figure 3. Positive charges show an additive (linear) trend in slowing ribosomes, but rare codons do not.
The degree of slowing is a function of both the magnitude of ribosomal density and the length of transcript the slowing covers. Therefore, to measure any trend in the ability of either positive charges or codon clusters to slowing, the area between the curves depicting the average relative change in ribosomal density (rpos/rprec30) and the y = 1 null in Figure 2A, Figure S5A, and Figure 5, whether positive or negative, was summed between x = 0 (the beginning of the cluster) and the point where the plotted values intersect with y = 1 again, regardless of where the last charge in the cluster is (see Figure 1 for further explanation of the area under the curve). A positive value for the area under the curve indicates ribosomal slowing after the feature in question, while a negative value reflects faster movement. (A and B) Regression of area under curvesize of cluster, slope p = 0.45 and 0.33, respectively. (C) Regression of area under curvesize of cluster gives a slope of 2.81 (p = 0.020), r 2 = 0.93. To achieve such a regression slope in the set of genes used is significantly nonrandom (p = 0.011, Note S3).
Figure 4
Figure 4. Ribosomes travelling along single-stranded RNA are not greatly retarded upon traversal into double-stranded structures.
PARS values >0 denote structured mRNA, <0 single-stranded. All averages plotted (± s.e.m.) are calculated across transcripts aligned by blocks of mRNA structure. The slowing of ribosomes (rpos/rprec30>1) relative to the preceding 30 codons starting from both the beginning of double-stranded structure (A) and 10 codons upstream of the same regions of double-stranded structure (B) are shown. In both cases, there is a degree of translational pausing observed upon the transition into folded mRNA, although some of this slowing may be caused by the presence of two or more positive charges encoded in the folded area (0≥x≤30).
Figure 5
Figure 5. Positive charges slow ribosomes.
The first of the positive charges indicated always occurs at x = 0, and the rest, if any, may be found at points up to and including the codon indicated by the second arrowhead. rpos/rprec30 is the ribosomal occupancy at position x normalized by the average occupancy of the 30 codons preceding the encoded positively charged cluster within the same transcript. The mean rpos/rprec30, or average relative change in ribosomal occupancy, at each position across aligned transcripts ± s.e.m. is plotted. The horizontal at y = 1 represents the null expectation that positive charges do not alter ribosomal speed; in other words, that ribosomes which translate in positive-charge free peptides are, on the average, as frequently present before the charge cluster as after it.

Comment in

References

    1. Randall LL, Josefsson LG, Hardy SJ (1980) Novel intermediates in the synthesis of maltose-binding protein in Escherichia coli. Eur J Biochem 107: 375–379. - PubMed
    1. Siller E, DeZwaan DC, Anderson JF, Freeman BC, Barral JM (2010) Slowing bacterial translation speed enhances eukaryotic protein folding efficiency. J Mol Biol 396: 1310–1318. - PubMed
    1. Doma MK, Parker R (2006) Endonucleolytic cleavage of eukaryotic mRNAs with stalls in translation elongation. Nature 440: 561–564. - PMC - PubMed
    1. Yanofsky C (1981) Attenuation in the control of expression of bacterial operons. Nature 289: 751–758. - PubMed
    1. Chartrand P, Meng XH, Huttelmaier S, Donato D, Singer RH (2002) Asymmetric sorting of ash1p in yeast results from inhibition of translation by localization elements in the mRNA. Mol Cell 10: 1319–1330. - PubMed

Publication types

MeSH terms