

Apparent diffusion coefficient in normal and abnormal pattern of intervertebral lumbar discs: initial experience
- PMID: 23554690
- PMCID: PMC3597053
- DOI: 10.1016/S1674-8301(11)60026-2
Apparent diffusion coefficient in normal and abnormal pattern of intervertebral lumbar discs: initial experience
Abstract
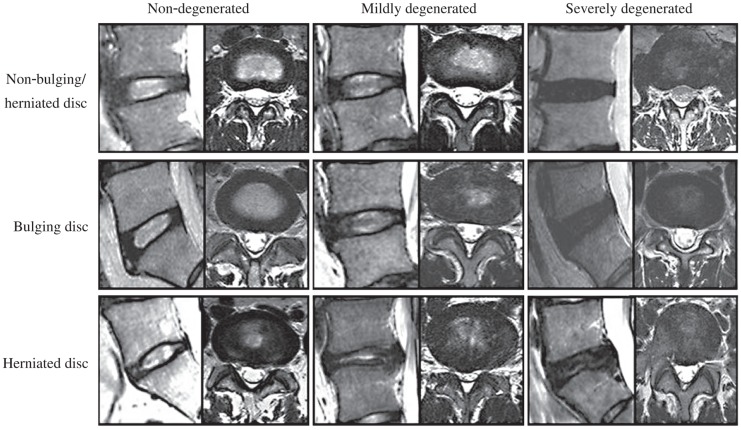
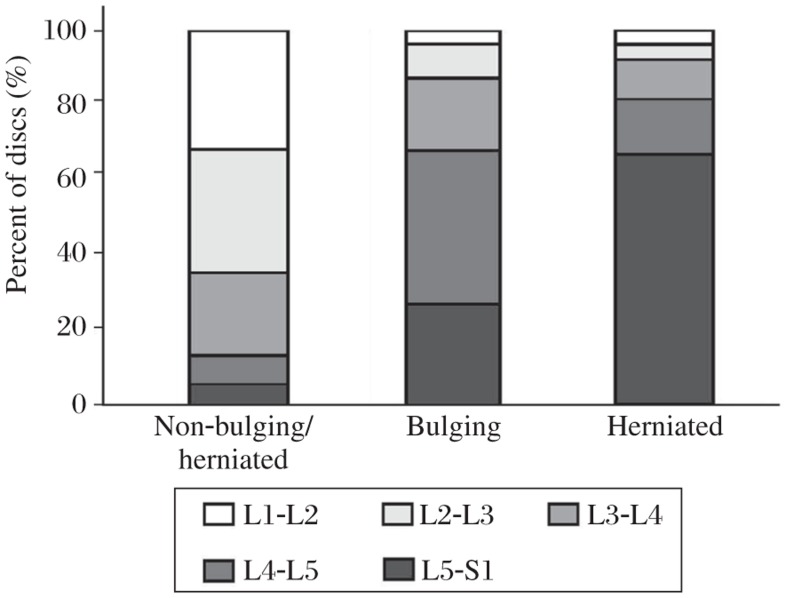
The aim of the present study was to compare the relationship of morphologically defined non-bulging/herniated, bulging and herniated intervertebral lumbar discs with quantitative apparent diffusion coefficient (ADC). Thirty-two healthy volunteers and 28 patients with back pain or sciatica were examined by MRI. All intervertebral lumbar discs from L1 to S1 were classified according to morphological abnormality and degenerated grades. The ADC values of nucleus pulposus (NP) were measured and recorded. The significant differences about mean ADC values of NP were found between non-bulging/herniated discs and bulging discs as well as herniated discs (P < 0.05), whereas there were no significant differences in ADC values between bulging and herniated discs (P > 0.05). Moreover, statistically significant relationship was found in the mean ADC values of NP between "non-bulging/herniated and non-degenerated discs" and "non-bulging/herniated degenerated discs" as well as herniated discs (P < 0.05). Linear regression analysis between ADC value and disc level revealed an inverse correlation (r = -0.18). The ADC map of the NP is a potentially useful tool for the quantitative assessment of componential and molecular alterations accompanied with lumbar disc abnormalities.
Keywords: apparent diffusion coefficient; disc bulging; disc herniation; intervertebral lumbar disc.
Conflict of interest statement
The authors reported no conflict of interests.
Figures


References
-
- Zhang YG, Sun Z, Zhang Z, Liu J, Guo X. Risk factors for lumbar intervertebral disc herniation in Chinese population: a case-control study. Spine (Phila Pa 1976) 2009;34:918–22. - PubMed
-
- Zou J, Yang H, Miyazaki M, Wei F, Hong SW, Yoon SH, et al. Missed lumbar disc herniations diagnosed with kinetic magnetic resonance imaging. Spine (Phila Pa 1976) 2008;33:140–4. - PubMed
-
- Derby R, Kim BJ, Lee SH, Chen Y, Seo KS, Aprill C. Comparison of discographic findings in asymptomatic subject discs and the negative discs of chronic LBP patients: can discography distinguish asymptomatic discs among morphologically abnormal discs? Spine J. 2005;5:389–94. - PubMed
-
- Miyazaki M, Hong SW, Yoon SH, Morishita Y, Wang JC. Reliability of a magnetic resonance imaging-based grading system for cervical intervertebral disc degeneration. J Spinal Disord Tech. 2008;21:288–92. - PubMed
-
- Waris E, Eskelin M, Hermunen H, Kiviluoto O, Paajanen H. Disc degeneration in low back pain: a 17-year follow-up study using magnetic resonance imaging. Spine (Phila Pa 1976) 2007;32:681–4. - PubMed
LinkOut - more resources
Full Text Sources
Miscellaneous