. 2013;8(3):e58313.
doi: 10.1371/journal.pone.0058313. Epub 2013 Mar 15.

Calcium induced regulation of skeletal troponin--computational insights from molecular dynamics simulations

Affiliations

Calcium induced regulation of skeletal troponin--computational insights from molecular dynamics simulations

Georgi Z Genchev et al. PLoS One. 2013.

Abstract

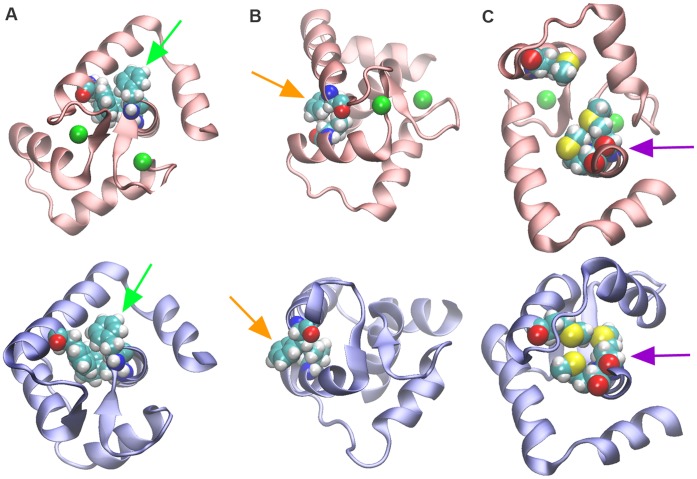
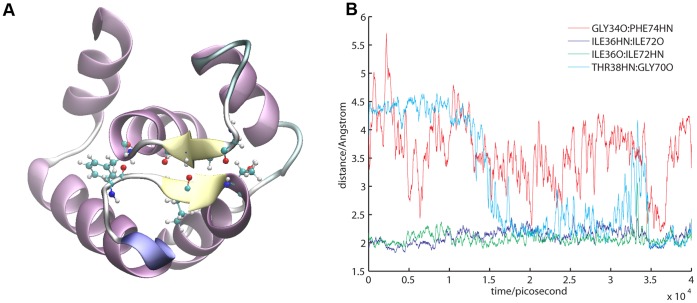
The interaction between calcium and the regulatory site(s) of striated muscle regulatory protein troponin switches on and off muscle contraction. In skeletal troponin binding of calcium to sites I and II of the TnC subunit results in a set of structural changes in the troponin complex, displaces tropomyosin along the actin filament and allows myosin-actin interaction to produce mechanical force. In this study, we used molecular dynamics simulations to characterize the calcium dependent dynamics of the fast skeletal troponin molecule and its TnC subunit in the calcium saturated and depleted states. We focused on the N-lobe and on describing the atomic level events that take place subsequent to removal of the calcium ion from the regulatory sites I and II. A main structural event - a closure of the A/B helix hydrophobic pocket results from the integrated effect of the following conformational changes: the breakage of H-bond interactions between the backbone nitrogen atoms of the residues at positions 2, 9 and sidechain oxygen atoms of the residue at position 12 (N(2)-OE(12)/N(9)-OE(12)) in sites I and II; expansion of sites I and II and increased site II N-terminal end-segment flexibility; strengthening of the β-sheet scaffold; and the subsequent re-packing of the N-lobe hydrophobic residues. Additionally, the calcium release allows the N-lobe to rotate relative to the rest of the Tn molecule. Based on the findings presented herein we propose a novel model of skeletal thin filament regulation.


Conflict of interest statement

Competing Interests: The authors have declared that no competing interests exist.

Figures

Figure 1
Figure 1. The core domain of the troponin molecule.
The Ca2+ sensor troponin consist of 3 subunits. The TnI subunit is shown in blue, the TnC subunit is shown in red and the TnT subunit is show in yellow. Ca2+ ions located in sites I through IV are shown as green vdW spheres. Sites III and IV located in the IT arm have a higher affinity to Ca2+ and do not serve a regulatory role. The N-terminal of TnT, the C-terminal of TnT and the C-terminal of TnI are not present in the crystal structure and are not displayed herein. Molecular coordinates were obtained from 1YTZ.pdb.
Figure 2
Figure 2. Open and closed state of the N-lobe. Time dependence of TnC hydrophobic pocket opening distance (d).
A, B The TnC N-lobe is shown in red in the Ca2+ saturated, open state; and in blue in the Ca2+ depleted, closed state. Panel A shows the N-lobe viewed from the side, panel B shows the N-lobe viewed from the C-lobe. The open and closed state structures are aligned along the D helix. Ca2+ ions are shown as green vdW spheres and TnC residues with resid>85 are not shown. C. Openness of the TnC N lobe A/B helix hydrophobic pocket measured as the distance d between alpha-C of GLU16 and alpha-C of LEU48 in saturated TnC and depleted TnC. At the start of the simulation both TnC structures (depleted and saturated) are in the open state (marked by purple asterisk) and evolve to a closed state (marked by light blue asterisk) for the depleted TnC or semi-closed state (marked by orange asterisk) for the saturated TnC. The blue line depicts the time dependent evolution of the pocket opening distance d of depleted TnC; the red line depicts the time dependent evolution of the pocket opening distance d of saturated TnC.
Figure 3
Figure 3. RMSF of TnC N-lobe.
A. RMSF for each residue alpha-C of TnC N-lobe (residues 5–80) measured in the core troponin complex (TnC-TnT-TnI) simulations. Ca2+ depleted observation shown in cyan, Ca2+ saturated observation shown in magenta. B. RMSF for each residue alpha-C of TnC N-lobe (residues 5–80) measured in site occupied/site depleted simulations. Measurement for TnCSite1NoCa2+ shown in green and TnC Site2NoCa2+ shown in black. C. RMSF for each residue alpha-C of TnC N-lobe (residues 5–80) measured in TnC simulations. Ca2+ depleted observation shown in blue, Ca2+ saturated observation shown in red. Colorful bar in the top and bottom of the figure shows the segments of the N-lobe as related to residue number.
Figure 4
Figure 4. Breakage of the N2-OE12 and N9-OE12 ‘prong’ interaction and expansion of the Ca2+ binding pocket at sites I and II.
Trajectory snapshots for the open and closed state. A. Ca2+ binding site I is shown in the TnC saturated, open state (left panel) and the depleted, closed state (middle panel). The residues forming the interactions N2-OE12 and N9-OE12 are shown as vdW representation (residues ASP30, SER37, GLU40 in site I). The interactions are well maintained in the saturated, open state (red tube) and are released in the depleted, closed state (blue tube). The right panel show a superimposition of site I in the two states. The distance between the alpha-C atoms of the residues located at positions , is increased following Ca2+ release and the binding pocket expands. B. Ca2+ binding site II is shown in the TnC saturated, open state (left panel) and the depleted, closed state (middle panel). The residues forming the interactions N2-OE12 and N9-OE12 are shown as vdW representation (residues GLU66, ASP73 and GLU76 in site II). The interactions are well maintained in the saturated, open state (red tube) and are released in the depleted, closed state (blue tube). The right panel show a superimposition of site II in the two states. The distance between the alpha-C atoms of the residues located at positions , is increased following Ca2+ release and the binding pocket expands.
Figure 5
Figure 5. Hydrophobic core and hydrophobic residue re-packing following release of Ca2+.
In all panels the saturated, open state N-lobe TnC is shown in red and the depleted, closed state N-lobe TnC is shown in blue. A. A hydrophobic PHE scaffold remains undisturbed in the open to closed transition. Residues PHE74, PHE77 and PHE25 are shown as vdW spheres. Top panel shows the TnC open state, bottom panel shows the TnC closed state. Green arrows point to PHE74 in each panel. B. Expulsion of residue PHE28 into the solvent and sliding of VAL44 into the hydrophobic core in the open to closed transition. Top panel shows the TnC open state, bottom panel shows the TnC closed state. Orange arrows point to PHE28 in each panel. C. Tight repacking of MET81, MET80 and MET45, which finish in a tight formation upon closure of the hydrophobic pocket, takes place in the open to closed transition. Top panel shows the TnC open state, bottom panel shows the TnC closed state. Violet arrows point to MET80 and MET81 in each panel.
Figure 6
Figure 6. Consolidation of the β-sheet upon Ca2+ release. A.
Structural view of the small β-sheet located at the ‘top’ of the TnC N-lobe. Key residues GLY34, ILE36, THR38, GLY70, ILE 72 and PHE74 shows as CPK representation. B. Distances between HN and acceptor O for each of the four H-bond partners are shown. The time evolution of the distances is measured in the open to closed transition in a simulation of Ca2+ depleted TnC.

References

    1. Kobayashi T, Solaro RJ (2005) Calcium, thin filaments, and the integrative biology of cardiac contractility. Annu Rev Physiol 67: 39–67. - PubMed
    1. Kobayashi T, Jin L, de Tombe PP (2008) Cardiac thin filament regulation. Pflugers Arch 457: 37–46. - PMC - PubMed
    1. Arteaga GM, Kobayashi T, Solaro RJ (2002) Molecular actions of drugs that sensitize cardiac myofilaments to Ca2+. Ann Med 34: 248–258. - PubMed
    1. Endoh M (2008) Cardiac Ca2+ signaling and Ca2+ sensitizers. Circ J 72: 1915–1925. - PubMed
    1. McCammon JA, Gelin BR, Karplus M (1977) Dynamics of folded proteins. Nature 267: 585–590. - PubMed

Publication types

LinkOut - more resources