

Breast cancer and obesity: in vitro interferences between adipokines and proangiogenic features and/or antitumor therapies?
- PMID: 23554900
- PMCID: PMC3598910
- DOI: 10.1371/journal.pone.0058541
Breast cancer and obesity: in vitro interferences between adipokines and proangiogenic features and/or antitumor therapies?
Abstract
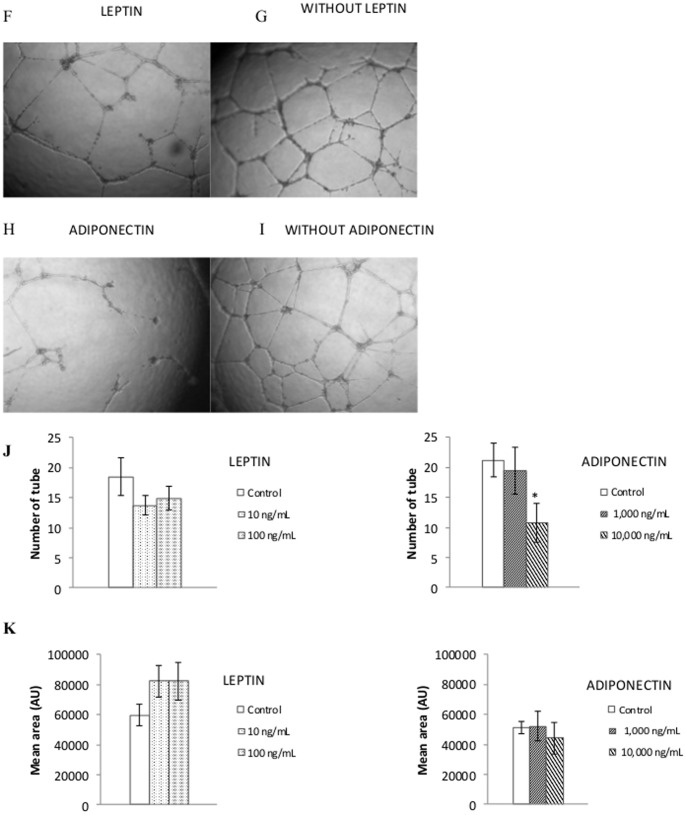
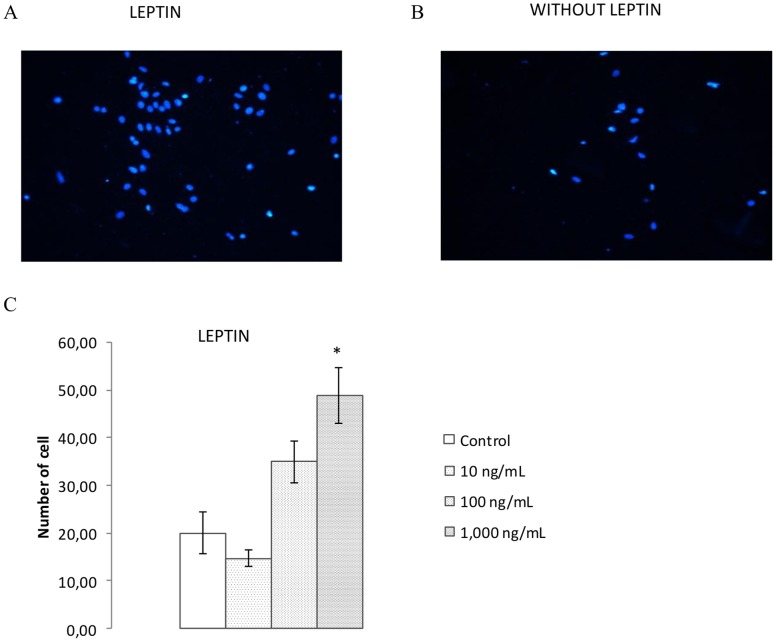
Obesity is now considered as a risk factor for breast cancer in postmenopausal women. Adipokine levels are modulated in obesity, and may play a role in carcinogenesis. Moreover, obesity increases risk of cancer mortality. Here, we hypothesized that this increase could be due to a modification in angiogenesis, capital event in the development of metastases, and/or in effectiveness of cancer treatments. To test these assumptions, following a same experimental design and simultaneously the effects of leptin and adiponectin on angiogenesis were investigated, and the impact of hyperleptinemia on anticancer drug effectiveness was measured in physiological and obesity situations. Focusing on angiogenesis, the proliferation of endothelial cells (HUVEC), which expressed leptin and adiponectin receptors, was stimulated by leptin and inhibited by adiponectin. Both adipokines globally reduced apoptosis and caspase activity. Leptin increased migration whereas adiponectin decreased migration, and leptin enhanced the area of the tubes formed by HUVEC cells while adiponectin inhibited their formation. MCF7 and MDA-MB-231 cells treated with leptin secreted more VEGF than untreated cells, whereas adiponectin treatment inhibited VEGF secretion. Finally, MCF7 cells pre-treated with leptin were more invasive than untreated cells. This effect was not reproduced in MDA-MB-231 cells. In the MCF7 breast cancer cell line, leptin could induce cell proliferation and reduced the efficacy of all breast cancer therapies (tamoxifen, 5-fluorouracil, taxol and vinblastin). These results suggest that, in obesity situation, leptin- in contrast to adiponectin - may promote tumor invasion and angiogenesis, leading to metastases 'apparition, and reduce treatment efficacy, which could explain the increased risk of cancer mortality in cases of overweight. The evidence suggests adipokines influence breast cancer issue and could play a significant role, especially in obese patients for which hyperleptinemia, hypoadiponectinemia and increased metastatic potential are described.
Conflict of interest statement
Figures


Similar articles
-
Supernatants of Adipocytes From Obese Versus Normal Weight Women and Breast Cancer Cells: In Vitro Impact on Angiogenesis.J Cell Physiol. 2017 Jul;232(7):1808-1816. doi: 10.1002/jcp.25701. Epub 2016 Dec 20. J Cell Physiol. 2017. PMID: 27886379
-
Adiponectin and Leptin Exert Antagonizing Effects on HUVEC Tube Formation and Migration Modulating the Expression of CXCL1, VEGF, MMP-2 and MMP-9.Int J Mol Sci. 2021 Jul 13;22(14):7516. doi: 10.3390/ijms22147516. Int J Mol Sci. 2021. PMID: 34299135 Free PMC article.
-
Involvement of adiponectin and leptin in breast cancer: clinical and in vitro studies.Endocr Relat Cancer. 2009 Dec;16(4):1197-210. doi: 10.1677/ERC-09-0043. Epub 2009 Aug 6. Endocr Relat Cancer. 2009. PMID: 19661131
-
Obesity and breast cancer: status of leptin and adiponectin in pathological processes.Cancer Metastasis Rev. 2010 Dec;29(4):641-53. doi: 10.1007/s10555-010-9252-1. Cancer Metastasis Rev. 2010. PMID: 20821253 Review.
-
Obesity and leptin in breast cancer angiogenesis.Front Endocrinol (Lausanne). 2024 Oct 8;15:1465727. doi: 10.3389/fendo.2024.1465727. eCollection 2024. Front Endocrinol (Lausanne). 2024. PMID: 39439572 Free PMC article. Review.
Cited by
-
Hormonal Therapy Resistance and Breast Cancer: Involvement of Adipocytes and Leptin.Nutrients. 2019 Nov 20;11(12):2839. doi: 10.3390/nu11122839. Nutrients. 2019. PMID: 31756890 Free PMC article.
-
Modulation of the leptin receptors expression in breast cancer cell lines exposed to leptin and tamoxifen.Sci Rep. 2019 Dec 16;9(1):19189. doi: 10.1038/s41598-019-55674-x. Sci Rep. 2019. PMID: 31844100 Free PMC article.
-
Liraglutide attenuates obese-associated breast cancer cell proliferation via inhibiting PI3K/Akt/mTOR signaling pathway.Saudi Pharm J. 2024 Jan;32(1):101923. doi: 10.1016/j.jsps.2023.101923. Epub 2023 Dec 18. Saudi Pharm J. 2024. PMID: 38223522 Free PMC article.
-
Suberoylanilide hydroxamic acid-induced specific epigenetic regulation controls Leptin-induced proliferation of breast cancer cell lines.Oncotarget. 2017 Jan 10;8(2):3364-3379. doi: 10.18632/oncotarget.13764. Oncotarget. 2017. PMID: 27926517 Free PMC article.
-
Lunasin Attenuates Obesity-Associated Metastasis of 4T1 Breast Cancer Cell through Anti-Inflammatory Property.Int J Mol Sci. 2016 Dec 15;17(12):2109. doi: 10.3390/ijms17122109. Int J Mol Sci. 2016. PMID: 27983683 Free PMC article.
References
-
- Bjorntorp P (1991) Adipose tissue distribution and function. Int J Obes 15 Suppl 267–81. - PubMed
-
- Stephenson GD, Rose DP (2003) Breast cancer and obesity: an update. Nutr Cancer 45(1): 1–16. - PubMed
-
- Calle EE, Kaaks R (2004) Overweight, obesity and cancer: epidemiological evidence and proposed mechanisms. Nat Rev Cancer 4(8): 579–91. - PubMed
-
- Cleary MP, Maihle NJ (1997) The role of body mass index in the relative risk of developing premenopausal versus postmenopausal breast cancer. Proc Soc Exp Biol Med 216(1): 28–43. - PubMed
-
- Loi S, Milne RL, Friedlander ML, McCredie MR, Giles GG, et al. (2005) Obesity and outcomes in premenopausal and postmenopausal breast cancer. Cancer Epidemiol Biomarkers Prev 14(7): 1686–91. - PubMed
Publication types
MeSH terms
Substances
LinkOut - more resources
Full Text Sources
Other Literature Sources
Medical
Miscellaneous
