. 2013;8(3):e58563.
doi: 10.1371/journal.pone.0058563. Epub 2013 Mar 12.

Genome and transcriptome analyses provide insight into the euryhaline adaptation mechanism of Crassostrea gigas

Affiliations

Genome and transcriptome analyses provide insight into the euryhaline adaptation mechanism of Crassostrea gigas

Jie Meng et al. PLoS One. 2013.

Abstract

Background: The Pacific oyster, Crassostrea gigas, has developed special mechanisms to regulate its osmotic balance to adapt to fluctuations of salinities in coastal zones. To understand the oyster's euryhaline adaptation, we analyzed salt stress effectors metabolism pathways under different salinities (salt 5, 10, 15, 20, 25, 30 and 40 for 7 days) using transcriptome data, physiology experiment and quantitative real-time PCR.

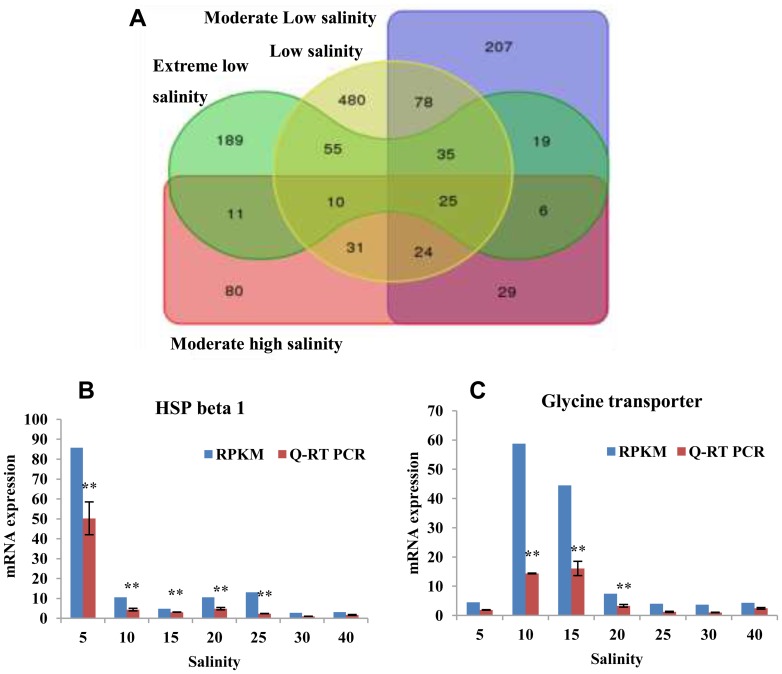
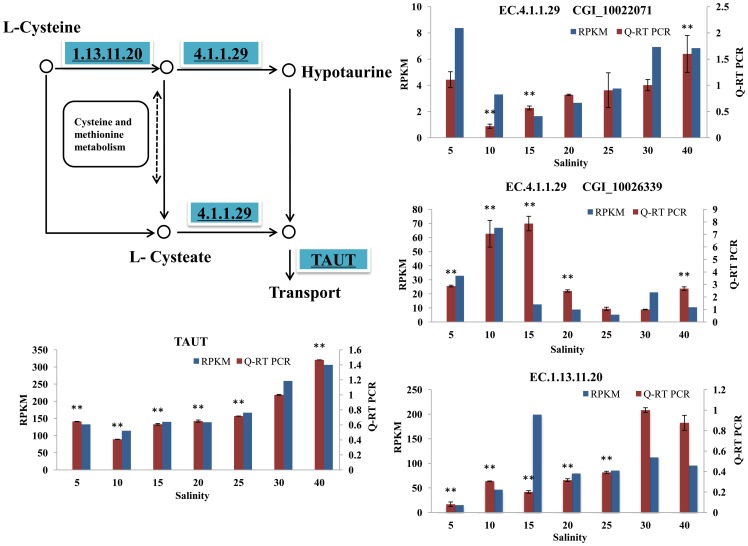
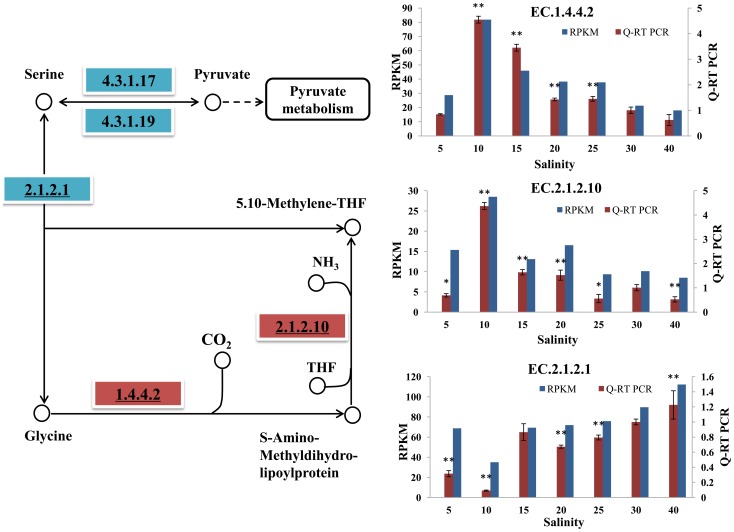
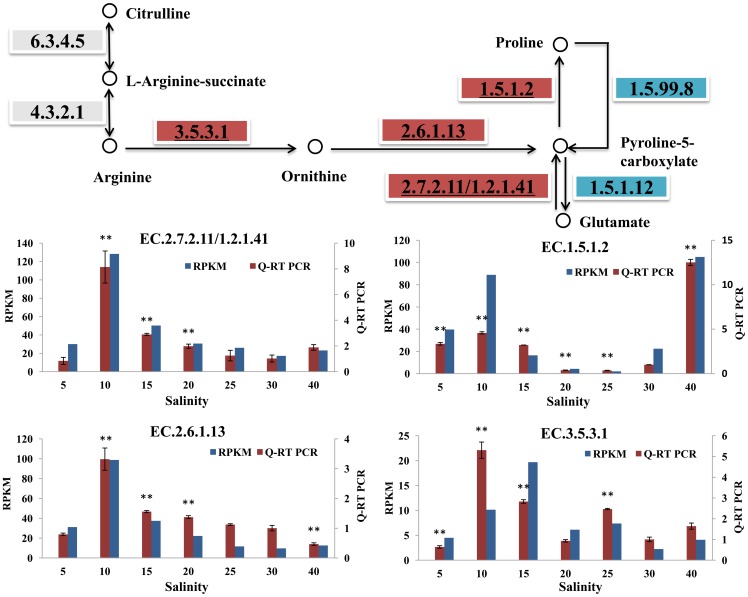
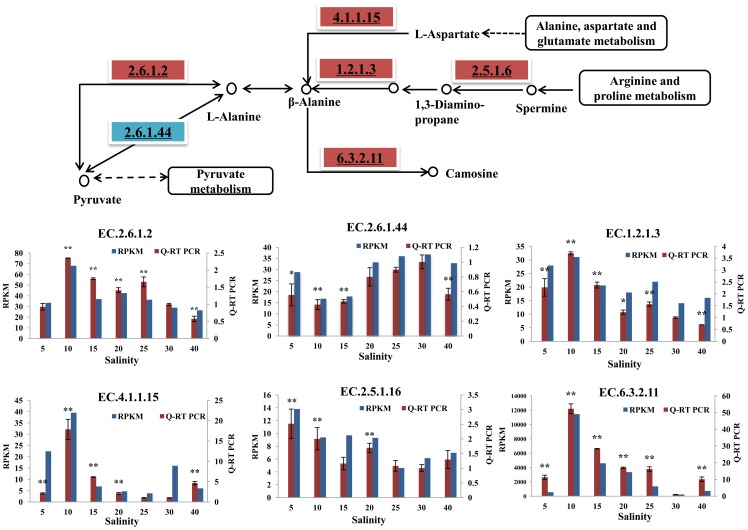
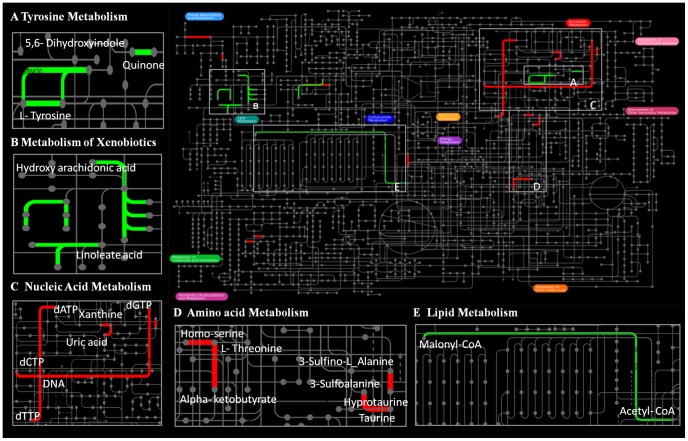
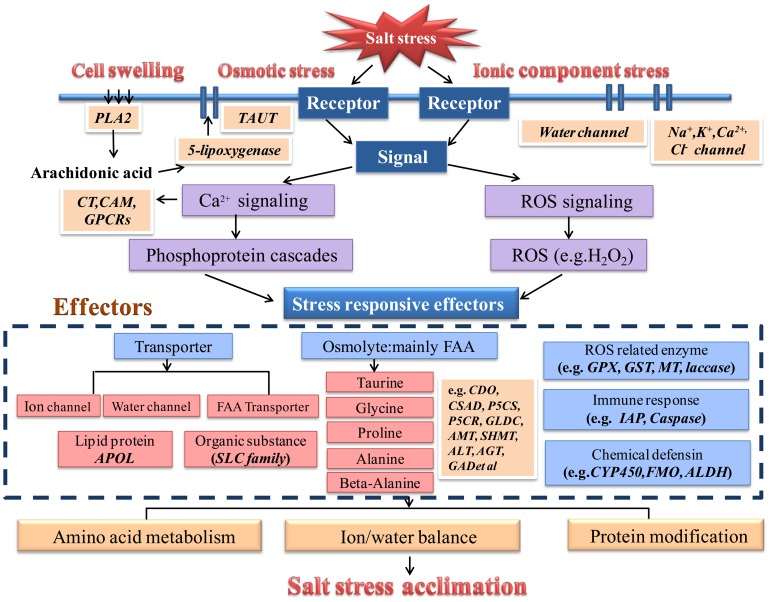
Results: Transcriptome data uncovered 189, 480, 207 and 80 marker genes for monitoring physiology status of oysters and the environment conditions. Three known salt stress effectors (involving ion channels, aquaporins and free amino acids) were examined. The analysis of ion channels and aquaporins indicated that 7 days long-term salt stress inhibited voltage-gated Na(+)/K(+) channel and aquaporin but increased calcium-activated K(+) channel and Ca(2+) channel. As the most important category of osmotic stress effector, we analyzed the oyster FAAs metabolism pathways (including taurine, glycine, alanine, beta-alanine, proline and arginine) and explained FAAs functional mechanism for oyster low salinity adaptation. FAAs metabolism key enzyme genes displayed expression differentiation in low salinity adapted individuals comparing with control which further indicated that FAAs played important roles for oyster salinity adaptation. A global metabolic pathway analysis (iPath) of oyster expanded genes displayed a co-expansion of FAAs metabolism in C. gigas compared with seven other species, suggesting oyster's powerful ability regarding FAAs metabolism, allowing it to adapt to fluctuating salinities, which may be one important mechanism underlying euryhaline adaption in oyster. Additionally, using transcriptome data analysis, we uncovered salt stress transduction networks in C. gigas.

Conclusions: Our results represented oyster salt stress effectors functional mechanisms under salt stress conditions and explained the expansion of FAAs metabolism pathways as the most important effectors for oyster euryhaline adaptation. This study was the first to explain oyster euryhaline adaptation at a genome-wide scale in C. gigas.


Conflict of interest statement

Competing Interests: The authors have declared that no competing interests exist.

Figures

Figure 1
Figure 1. Marker genes search under different salinity treatments.
(A) Venn diagram of gene sets identified under various salt stress conditions. The green region indicates ‘extreme low salt stress’ (salt 5); The yellow indicates ‘low salt stress’ (salt 10 and 15); The blue indicates ‘moderate low salt stress’ (salt 20 and 25); The red indicates ‘moderate high salt stress’ (salt 40). (B, C) The expressions of HSP beta 1 (B) and Glycine transporter (C) in transcriptome data and Q-RT PCR. For Q-RT PCR data, vertical bars represent the mean ± S.D (N  =  3). Significant differences between salt stress treatment (salt 5, 10, 15, 20, 25 and 40) and control (salt 30) are analyzed by one-way ANOVA (**P<0.01, *P<0.05).
Figure 2
Figure 2. Pathway analysis for taurine metabolism.
The map displays selected steps from KEGG map00430, ‘Taurine and hypotaurine metabolism’. A red rectangle indicates increased expression of genes compared with salt 30, while a blue rectangle indicates decreased expression of genes. The EC number with an underline was validated via Q-RT PCR. The transcriptome data and Q-RT PCR data were displayed in the form of columnar diagram. For Q-RT PCR data, vertical bars represent the mean ± S.D (N  =  3). Significant differences between salt stress treatment (salt 5, 10, 15, 20, 25 and 40) and control (salt 30) are analyzed by one-way ANOVA (**P<0.01, *P<0.05).
Figure 3
Figure 3. Pathway analysis of glycine metabolism.
The map displays selected steps from KEGG map00260, ‘Glycine, serine and threonine metabolism’. A red rectangle indicates increased expression compared with salt 30, and blue indicates decreased expression compared with salt 30. The EC number with an underline was validated via Q-RT PCR. The transcriptome data and Q-RT PCR data were displayed in the form of columnar diagram. For Q-RT PCR data, vertical bars represent the mean ± S.D (N  =  3). Significant differences between salt stress treatment (salt 5, 10, 15, 20, 25 and 40) and control (salt 30) are analyzed by one-way ANOVA (**P<0.01, *P<0.05).
Figure 4
Figure 4. Pathway analysis of arginine and proline metabolism.
The map displays selected steps from KEGG map00330, ‘Arginine and proline metabolism’. A red rectangle indicates increased expression genes compared with salt 30, while blue indicates decreased expression of genes, and the gray rectangle indicates no significant changes. The EC number with an underline was validated via Q-RT PCR. The transcriptome data and Q-RT PCR data were displayed in the form of columnar diagram. For Q-RT PCR data, vertical bars represent the mean ± S.D (N  =  3). Significant differences between salt stress treatment (salt 5, 10, 15, 20, 25 and 40) and control (salt 30) are analyzed by one-way ANOVA (**P<0.01, *P<0.05).
Figure 5
Figure 5. Pathway analysis for alanine and beta-alanine metabolism.
The map displays selected steps from KEGG pathways map00473, ‘D-Alanine metabolism’, and map00410, ‘beta-Alanine metabolism’. A red rectangle indicates increased expression of genes compared with salt 30, while blue indicates decreased expression of genes. The EC number with an underline was validated via Q-RT PCR. The transcriptome data and Q-RT PCR data were displayed in the form of columnar diagram. For Q-RT PCR data, vertical bars represent the mean ± S.D (N  =  3). Significant differences between salt stress treatment (salt 5, 10, 15, 20, 25 and 40) and control (salt 30) are analyzed by one-way ANOVA (**P<0.01, *P<0.05).
Figure 6
Figure 6. Global metabolic pathway (iPath) analysis for expanding KOs.
Green lines represent expanded pathways in intertidal animals (C. gigas, Capitella capitata, Lottia gigantean, Strongylocentrotus purpuratus and Helobdella robusta) compared with terrestrial animals (Drosophila melanogaster, Apis mellifera and Homo sapiens), and the red line represents the oyster (C. gigas) expanded pathways compared with seven other species.
Figure 7
Figure 7. Molecular model of the oyster long-term salt stress response.
The map describes salt stress-related signal transduction, effectors and physiological changes in the oyster. The italicized characters in a rectangle with a white border indicate enriched genes under the salt stress response. PLA2: Phospholipase A2, CT: Calcitonin receptor, CAM: Calmodulin-like protein, GPCR: G-protein coupled receptor, TAUT: Taurine transporter, APOL: Apolipoprotein-L, APLP: The amyloid precursor-like protein, CDO: Cysteine dioxygenase, CSAD: Cysteine sulfinic acid decarboxylase, GLDC: Glycine dehydrogenase, AMT: Aminomethytransferase, P5CS: Δ-1- pyrroline-5-carboxylate synthase, P5CR: Δ-1-pyrroline-5-carboxylate reductase, ALT: Alanine transaminase, AGT: Alanine-glyoxylate transaminase, GAD: Glutamate decarboxylase, SHMT: Serine hydroxymethyl transferase, GPX: Glutathione peroxidase, GST: Glutathione S-transferase, MT: Metallothionein, IAP: Inhibitor apoptosis protein, CYP450: Cytochrome P450, FMO: Flavin-containing monooxygenase, ALDH: Aldehyde dehydrogenase.

Similar articles

Cited by

References

    1. Hedgecock D, Gaffney PM, Goulletquer P, Guo XM, Reece K, et al. (2005) The case for sequencing the Pacific oyster genome. J Shellfish Res 24: 429–441.
    1. Brown JR (1988) Multivariate Analyses of the Role of Environmental Factors in Seasonal and Site Related Growth Variation in the Pacific Oyster Crassostrea gigas . Mar Ecol Prog Ser 45: 225–236.
    1. Bartol IK, Mann R, Luckenbach M (1999) Growth and mortality of oysters (Crassostrea virginica) on constructed intertidal reefs: effects of tidal height and substrate level. J Exp Mar Biol Ecol 237: 157–184.
    1. Heilmayer O, Digialleonardo J, Qian LF, Roesijadi G (2008) Stress tolerance of a subtropical Crassostrea virginica population to the combined effects of temperature and salinity. Estuar Coast Shelf S 79: 179–185.
    1. Macinnes JR, Calabrese A (1979) Combined Effects of Salinity, Temperature, and Copper on Embryos and Early Larvae of the American Oyster, Crassostrea virginica . Arch Environ Con Tox 8: 553–562. - PubMed

Publication types

Substances