A large-scale, higher-level, molecular phylogenetic study of the insect order Lepidoptera (moths and butterflies)
- PMID: 23554903
- PMCID: PMC3595289
- DOI: 10.1371/journal.pone.0058568
A large-scale, higher-level, molecular phylogenetic study of the insect order Lepidoptera (moths and butterflies)
Abstract
Background: Higher-level relationships within the Lepidoptera, and particularly within the species-rich subclade Ditrysia, are generally not well understood, although recent studies have yielded progress. We present the most comprehensive molecular analysis of lepidopteran phylogeny to date, focusing on relationships among superfamilies.
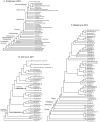
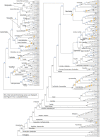
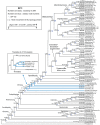
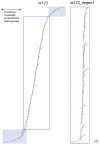
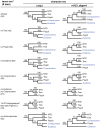
Methodology principal findings: 483 taxa spanning 115 of 124 families were sampled for 19 protein-coding nuclear genes, from which maximum likelihood tree estimates and bootstrap percentages were obtained using GARLI. Assessment of heuristic search effectiveness showed that better trees and higher bootstrap percentages probably remain to be discovered even after 1000 or more search replicates, but further search proved impractical even with grid computing. Other analyses explored the effects of sampling nonsynonymous change only versus partitioned and unpartitioned total nucleotide change; deletion of rogue taxa; and compositional heterogeneity. Relationships among the non-ditrysian lineages previously inferred from morphology were largely confirmed, plus some new ones, with strong support. Robust support was also found for divergences among non-apoditrysian lineages of Ditrysia, but only rarely so within Apoditrysia. Paraphyly for Tineoidea is strongly supported by analysis of nonsynonymous-only signal; conflicting, strong support for tineoid monophyly when synonymous signal was added back is shown to result from compositional heterogeneity.
Conclusions significance: Support for among-superfamily relationships outside the Apoditrysia is now generally strong. Comparable support is mostly lacking within Apoditrysia, but dramatically increased bootstrap percentages for some nodes after rogue taxon removal, and concordance with other evidence, strongly suggest that our picture of apoditrysian phylogeny is approximately correct. This study highlights the challenge of finding optimal topologies when analyzing hundreds of taxa. It also shows that some nodes get strong support only when analysis is restricted to nonsynonymous change, while total change is necessary for strong support of others. Thus, multiple types of analyses will be necessary to fully resolve lepidopteran phylogeny.
Conflict of interest statement
Figures

Similar articles
-
Can RNA-Seq resolve the rapid radiation of advanced moths and butterflies (Hexapoda: Lepidoptera: Apoditrysia)? An exploratory study.PLoS One. 2013 Dec 4;8(12):e82615. doi: 10.1371/journal.pone.0082615. eCollection 2013. PLoS One. 2013. PMID: 24324810 Free PMC article.
-
Comprehensive gene and taxon coverage elucidates radiation patterns in moths and butterflies.Proc Biol Sci. 2010 Sep 22;277(1695):2839-48. doi: 10.1098/rspb.2010.0392. Epub 2010 May 5. Proc Biol Sci. 2010. PMID: 20444718 Free PMC article.
-
Toward reconstructing the evolution of advanced moths and butterflies (Lepidoptera: Ditrysia): an initial molecular study.BMC Evol Biol. 2009 Dec 2;9:280. doi: 10.1186/1471-2148-9-280. BMC Evol Biol. 2009. PMID: 19954545 Free PMC article.
-
Phylogenomic data exploration with increased sampling provides new insights into the higher-level relationships of butterflies and moths (Lepidoptera).Mol Phylogenet Evol. 2024 Aug;197:108113. doi: 10.1016/j.ympev.2024.108113. Epub 2024 May 23. Mol Phylogenet Evol. 2024. Retraction in: Mol Phylogenet Evol. 2025 Jan;202:108251. doi: 10.1016/j.ympev.2024.108251. PMID: 38796071 Retracted.
-
Lepidopteran biodiversity of Ethiopia: current knowledge and future perspectives.Zookeys. 2019 Oct 23;882:87-125. doi: 10.3897/zookeys.882.36634. eCollection 2019. Zookeys. 2019. PMID: 31686952 Free PMC article. Review.
Cited by
-
The giant butterfly-moth Paysandisia archon has spectrally rich apposition eyes with unique light-dependent photoreceptor dynamics.J Comp Physiol A Neuroethol Sens Neural Behav Physiol. 2018 Jul;204(7):639-651. doi: 10.1007/s00359-018-1267-z. Epub 2018 Jun 4. J Comp Physiol A Neuroethol Sens Neural Behav Physiol. 2018. PMID: 29869100 Free PMC article.
-
Phylogenetic relationships of subfamilies in the family Hesperiidae (Lepidoptera: Hesperioidea) from China.Sci Rep. 2015 Jun 10;5:11140. doi: 10.1038/srep11140. Sci Rep. 2015. PMID: 26059470 Free PMC article.
-
Differences in nicotine metabolism of two Nicotiana attenuata herbivores render them differentially susceptible to a common native predator.PLoS One. 2014 Apr 22;9(4):e95982. doi: 10.1371/journal.pone.0095982. eCollection 2014. PLoS One. 2014. PMID: 24755743 Free PMC article.
-
A Linnaeus NG (TM) interactive key to the Lithocolletinae of North-West Europe aimed at accelerating the accumulation of reliable biodiversity data (Lepidoptera, Gracillariidae).Zookeys. 2014 Jul 3;(422):87-101. doi: 10.3897/zookeys.422.7446. eCollection 2014. Zookeys. 2014. PMID: 25061390 Free PMC article.
-
Complete mitochondrial genome of Amorophaga japonica Robinson, 1986 (Lepidoptera: Tineidae).Mitochondrial DNA B Resour. 2020 Jun 5;5(3):2342-2344. doi: 10.1080/23802359.2020.1774437. Mitochondrial DNA B Resour. 2020. PMID: 33457784 Free PMC article.
References
-
- van Nieukerken EJ, Kaila L, Kitching IJ, Kristensen NP, Lees DC, et al. (2011) Order Lepidoptera Linnaeus, 1758. In Zhang, Z.-Q. (Ed.) Animal Biodiversity: An outline of higher level classification and survey of taxonomic richness. . Order Lepidoptera Linnaeus, 1758. Zootaxa. 3148: 212–221.
-
- Wagner DL (2001) Moths. In Levin S.A. (Ed.) Encyclopedia of Biodiversity, Academic Press, San Diego, CA. Pages 249–270.
-
- Roe AD, Weller SJ, Baixeras J, Brown J, Cummings MP, et al... (2009) Evolutionary Framework for Lepidoptera Model Systems. In Goldsmith, M.R., Marec, F. (Eds.) Molecular Biology and Genetics of the Lepidoptera. CRC Press / Taylor & Francis (Contemporary Topics in Entomology series).Boca Raton, Florida. Pages 1–24.
Publication types
MeSH terms
LinkOut - more resources
Full Text Sources
Other Literature Sources

