. 2013;8(3):e58622.
doi: 10.1371/journal.pone.0058622. Epub 2013 Mar 12.

Functional implications of microRNA-215 in TGF-β1-induced phenotypic transition of mesangial cells by targeting CTNNBIP1

Affiliations

Functional implications of microRNA-215 in TGF-β1-induced phenotypic transition of mesangial cells by targeting CTNNBIP1

Jiao Mu et al. PLoS One. 2013.

Abstract

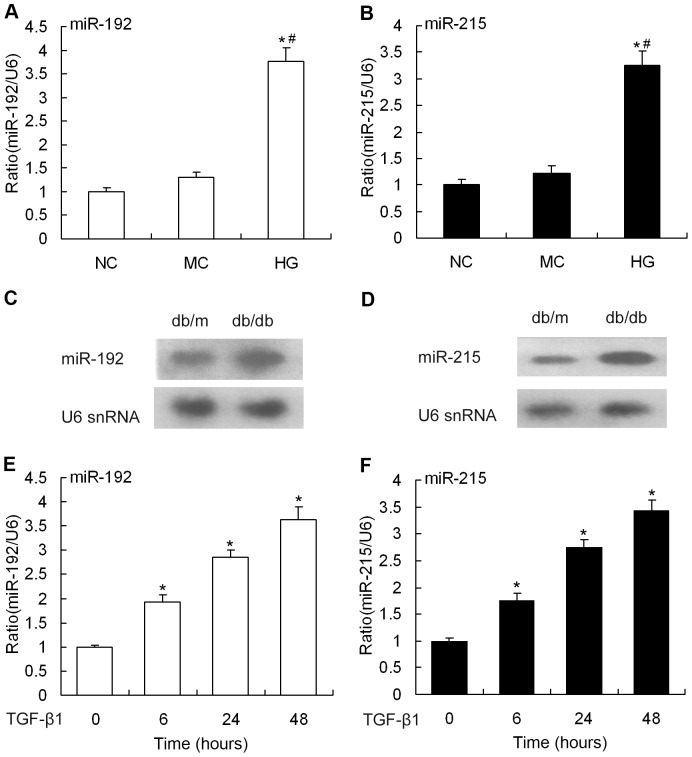
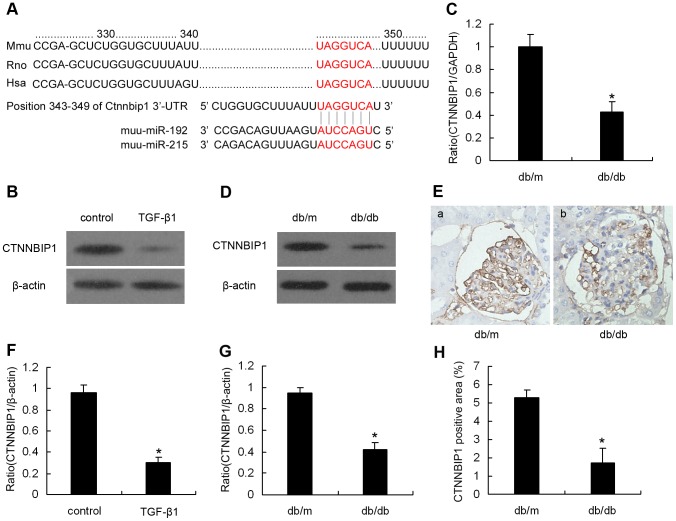
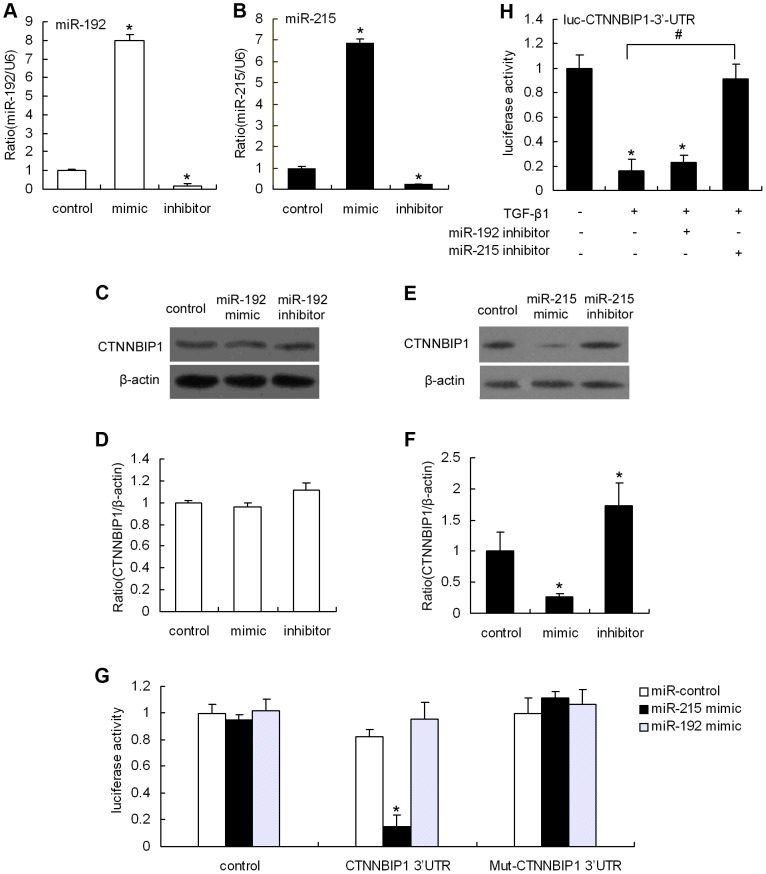
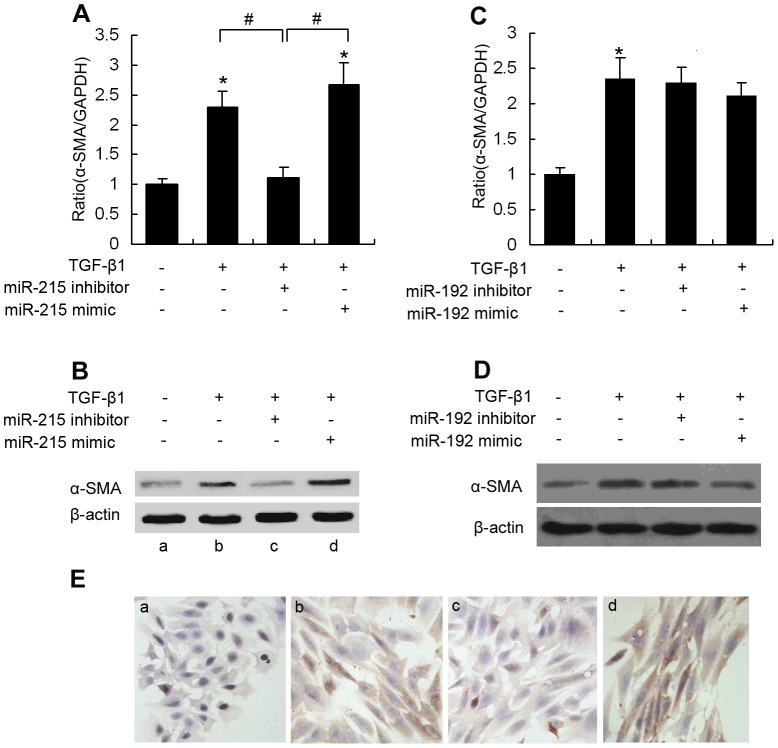
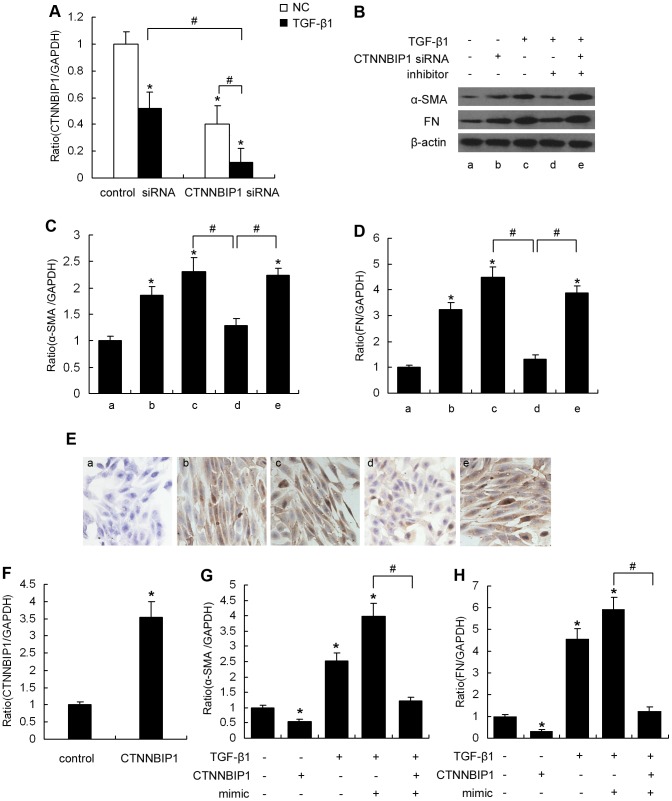
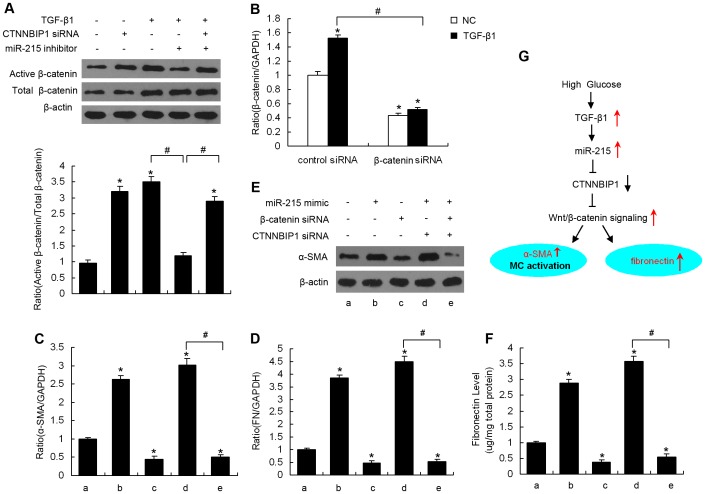
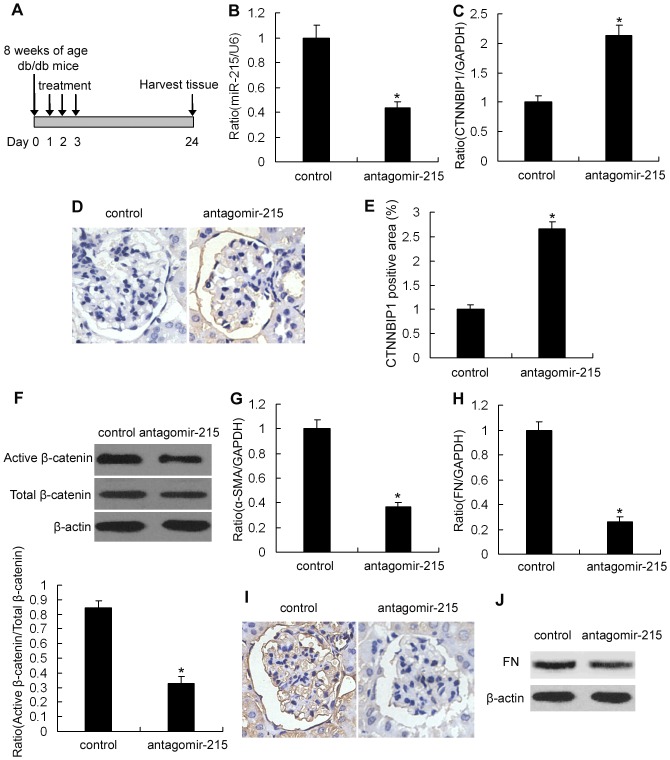
Mesangial cell (MC) phenotypic transition is crucial for the progression of diabetic nephropathy. A major stimulus mediating high glucose-induced MC phenotypic transition is TGF-β1. Our current study focuses on microRNA-215 (miR-215) and investigates its role in TGF-β1-mediated MC phenotypic transition. Using real-time quantitative PCR (qRT-PCR) and northern blotting, we determined that the miR-192/215 family is dramatically upregulated under diabetic conditions both in vitro and in vivo. Gain- and loss-of-function approaches demonstrated that miR-215 inhibition significantly inhibited TGF-β1-induced mouse mesangial cell (MMC) phenotypic transition, whereas miR-215 upregulation promoted MMC phenotypic transition. Interestingly, these changes were not detected in cells that were treated with TGF-β1 and miR-192 mimics or inhibitors. These results suggest that miR-215 participates in TGF-β1-induced MMC phenotypic transition. Luciferase reporter assays were used to identify whether catenin-beta interacting protein 1 (CTNNBIP1) is a direct target of miR-215, which was predicted by bioinformatic analysis. Mechanistic studies revealed that CTNNBIP1 suppresses Wnt/β-catenin signaling and that miR-215 promotes β-catenin activation and upregulates α-SMA and fibronectin expression in TGF-β1-treated MMCs by targeting CTNNBIP1. In addition, in vivo miR-215 silencing with a specific antagomir significantly increased CTNNBIP1 protein expression, resulting in reduced β-catenin activity and decreased α-SMA and fibronectin expression in db/db mouse kidney glomeruli. Taken together, our findings indicate that miR-215 plays an essential role in MC phenotypic transition by regulating the CTNNBIP1/β-catenin pathway, which is related to the pathogenesis of diabetic nephropathy.


Conflict of interest statement

Competing Interests: The authors have declared that no competing interests exist.

Figures

Figure 1
Figure 1. miR-192/215 expression upon treatment with high glucose and TGF-β1.
(A and B) MMCs were treated with high glucose (30 mM) for 48 hours, and miR-192/215 expression was determined by qRT-PCR, normalized to U6 snRNA. Data are shown as means ± SE (n = 3 per group) (*P<0.05 compared with normal control, #P<0.05 compared with mannitol control). (C and D) miR-192/215 expression in glomeruli from mouse models of type 2 diabetes (db/db mice, 10 weeks of age) was detected by northern blot and normalized to U6 snRNA. Data are shown as means ± SE (n = 6 per group). (E and F) qRT-PCR analysis of miR-192/215 expression in MMCs treated with TGF-β1 (10 ng/ml) at different time points (0, 6, 24, and 48 hour).U6 snRNA serves as a loading control. Data are shown as means ± SE (n = 3 per group) (*P<0.05 compared with normal control). NC, normal control; MC, mannitol control; HG, high glucose.
Figure 2
Figure 2. CTNNBIP1 is a potential miR-192/215 target.
(A) Sequence alignment of miR-192/215 and predicted binding sites in the 3’-UTR of CTNNBIP1 (http://www.targetscan.org). (B) Protein expression levels of CTNNBIP1 in MMCs in response to TGF-β1 (10 ng/ml for 48 hours). (F) is the quantification of the results shown in (B).Data are shown as means ± SE (n = 3 per group) (*P<0.05 compared with the control group).CTNNBIP1 mRNA (C) and protein (D and E) levels in glomeruli from type 2 diabetic mice (db/db mice, 10 weeks of age). (G) is the quantification of the results shown in (D). (H) Quantification of renal glomerular CTNNBIP1 positive staining area shown in (E). Data are shown as means ± SE (n = 6 per group) (*P<0.05 compared with control db/m mice). Magnification, ×400 in E.
Figure 3
Figure 3. CTNNBIP1 is a direct target gene of miR-215.
MMCs were treated with an miR-192 mimic (100 nM), an miR-192 inhibitor (100 nM) or the miR-control (100 nM) for 24 hours, miR-192 levels were determined by qRT-PCR (A), and subsequently analyzed for the level of CTNNBIP1 protein by Western blotting (C). (D) is the quantification of the results shown in (C). qRT-PCR results were normalized to U6 snRNA. Data are shown as means ± SE (n = 3 per group) (*P<0.05 compared with the miR-control group). MMCs were treated with an miR-215 mimic (100 nM), an miR-215 inhibitor (100 nM) or the miR-control (100 nM) for 24 hours, miR-215 levels were determined by qRT-PCR (B), and subsequently analyzed for the level of CTNNBIP1 protein by Western blotting (E). (F) is the quantification of the results shown in (E). qRT-PCR results were normalized to U6 snRNA. Data are shown as means ± SE (n = 3 per group) (*P<0.05 compared with the miR-control group). (G) Transient transfection of MMCs with the CTNNBIP1 3’-UTR or Mut-CTNNBIP1 3’-UTR constructs along with the miR-215 mimic, miR-192 mimic or miR-control, introduced 24 hours after transfection. Luciferase activities were measured and normalized to the control Renilla luciferase activity. Reporters without the CTNNBIP1 3’-UTR (control) or with Mut-CTNNBIP1 3’-UTR were used as the negative controls. Data are shown as means ± SE (n = 3 per group) (*P<0.05 compared with the cells transfected with the miR-control plus CTNNBIP1 3’-UTR). (H) For the TGF-β1 treatment experiments, cells were transfected with the luciferase reporter CTNNBIP1 3’-UTR alone or in combination with an miR-215 inhibitor (100 nM), an miR-192 inhibitor (100 nM) or an miR-control (100 nM), followed by treatment with TGF-β1 (10 ng/ml) for 24 hours. Luciferase activity was then analyzed (*P<0.05 compared with the untreated cells group, #P <0.05 as indicated).
Figure 4
Figure 4. miR-215 regulates MMC phenotypic transition induced by TGF-β1.
Cultured MMCs were transfected with an miR-215 mimic (100 nM), an miR-215 inhibitor (100 nM) or an miR-control (100 nM), followed by treatment with TGF-β1 (10 ng/ml) for 48 hours. qRT-PCR (A) and western blot (B)were used to analyze the expression of α-SMA levels in the cells. qRT-PCR results were normalized to GAPDH. Data are shown as means ± SE (n = 3 per group) (*P<0.05 compared with the untreated cells group, #P<0.05 as indicated). Cultured MMCs were transfected with an miR-192 mimic (100 nM), an miR-192 inhibitor (100 nM) or an miR-control (100 nM), followed by treatment with TGF-β1 (10 ng/ml) for 48 hours. qRT-PCR (C) and western blot (D)were used to analyze the expression of α-SMA levels in the cells. qRT-PCR results were normalized to GAPDH. Data are shown as means ± SE (n = 3 per group) (*P<0.05 compared with the untreated cells group, #P<0.05 as indicated). (E) Immunocytochemical staining for α-SMA in MMCs of different treatment groups. a, untreated MMCs; b-d, MMCs treated with TGF-β1 alone, TGF-β1 plus miR-215 inhibitor, or TGF-β1 plus miR-215 mimic, respectively. Magnification, ×200 in E.
Figure 5
Figure 5. CTNNBIP1 is involved in miR-215-mediated MMC phenotypic transition.
(A) MMCs were transfected with control siRNA (30 nM) or CTNNBIP1 siRNA (30 nM), and TGF-β1 (10 ng/ml) was added to indicated group at 12 hour after transfection. The expression of CTNNBIP1 was measured by qRT-PCR. Data are shown as means ± SE (n = 3 per group) (*P<0.05 compared with the normal control plus control siRNA group, #P <0.05 as indicated). MMCs were transfected with CTNNBIP1 siRNA (30 nM) and/or an miR-215 inhibitor (100 nM) as indicated. Following treatment with TGF-β1(10 ng/ml) or normal glucose for 48 hours, qRT-PCR and western blot were used to analyze the expression of α-SMA and FN mRNA (C and D) and protein (B) levels in the cells, respectively. qRT-PCR results were normalized to GAPDH. Data are shown as means ± SE (n = 3 per group) (*P<0.05 compared with the untreated cells group, #P <0.05 as indicated). (E) Immunocytochemical staining for α-SMA in MMCs of different treatment groups. a, untreated MMCs; b-e, MMCs treated with CTNNBIP1 siRNA, TGF-β1 alone, TGF-β1 plus miR-215 inhibitor, or TGF-β1 plus miR-215 inhibitor plus CTNNBIP1 siRNA, respectively. Magnification, ×200 in E. (F) MMCs were transfected with CTNNBIP1 expression plasmids (0.25 µg plasmid/well) for 24 hours, and qRT-PCR was used to analyze CTNNBIP1 expression levels. Control vectors were used as a negative control. qRT-PCR results were normalized to GAPDH. Data are shown as means ± SE (n = 3 per group) (*P<0.05 compared with the control vector group). MMCs were transfected with CTNNBIP1 expression plasmids (0.25 µg plasmid/well) or miR-215 mimics (100 nM) as indicated. TGF-β1 (10 ng/ml) was added to the indicated group 12 hours after transfection. α-SMA (G) and FN (H) expression levels were measured by qRT-PCR. Data are shown as means ± SE (n = 3 per group) (*P<0.05 compared with the control vector group, #P <0.05 as indicated). control, MMCs treated with control vectors; CTNNBIP1, MMCs treated with CTNNBIP1 expression vectors; mimic, miR-215 mimic; inhibitor, miR-215 inhibitor.
Figure 6
Figure 6. β-catenin is a signaling molecule downstream of CTNNBIP1 that is involved in miR-215-mediated phenotypic transition and fibronectin expression
. MMCs were transfected with CTNNBIP1 siRNA (30 nM) and/or an miR-215 inhibitors (100 nM) as indicated. Following treatment with TGF-β1 (10 ng/ml) or normal glucose for 48 hours, western blot analyses were performed for quantitation of activated β-catenin and total β-catenin protein levels (A). Data are shown as means ± SE (n = 3 per group) (*P<0.05 compared with the untreated cells group, #P<0.05 as indicated). (B) MMCs were transfected with control siRNA (100 nM) or β-catenin siRNA (100 nM), and TGF-β1 (10 ng/ml) was added to the indicated group 12 hours after transfection. β-catenin expression was measured by qRT-PCR and was normalized to GAPDH. Data are shown as means ± SE (n = 3 per group) (*P<0.05 compared with the normal control plus control siRNA group, #P <0.05 as indicated). MMCs were transfected with an miR-215 mimics (100 nM) and/or CTNNBIP1 siRNA (30 nM) as indicated. Following β-catenin siRNA (100 nM) or control siRNA (100 nM) treatment for 48 hours, qRT-PCR was used to analyze the α-SMA (C) and FN (D) mRNA expression in the cells. qRT-PCR results were normalized to GAPDH. Cellular α-SMA protein levels were examined by western blotting (E). Media was harvested by centrifugation, and fibronectin in the supernatant was measured by ELISA (F). Fibronectin concentration was normalized to the total protein in the media. Data are shown as means ± SE (n = 3 per group) (*P<0.05 compared with the untreated cells group, #P<0.05 as indicated). (G) Schematic drawing demonstrating a previously uncharacterized mechanism for TGF-β1-induced MC phenotypic transition and fibronectin accumulation in DN. a, untreated MMCs; b–e, MMCs treated with miR-215 mimic, β-catenin siRNA alone, miR-215 mimic plus CTNNBIP1 siRNA, or miR-215 mimic plus CTNNBIP1 siRNA plus β-catenin siRNA, respectively.
Figure 7
Figure 7. In vivo miR-215 inhibition reduces α-SMA and fibronectin expression.
(A) Design of prevention study. Db/db mice (8 weeks of age) were treated with antagomir-control or antagomir-215 (80 mg /kg body weight, three injections in three consecutive days) via the tail vein, and the kidneys were harvested three weeks after the last injection. miR-215 expression was determined by qRT-PCR (B) and subsequently analyzed for CTNNBIP1 mRNA (C) and protein (D) expression levels in glomeruli from antagomir-215-treated mice by qRT-PCR and immunohistochemical staining, respectively. qRT-PCR results were normalized to U6 snRNA. Data are shown as means ± SE (n = 6 per group) (*P<0.05 compared with antagomir-control treated mice). (E) Quantification of renal glomerular CTNNBIP1 positive staining area shown in (D). (F) Western blot analyses and quantitation of the activated and total β-catenin protein levels. Data are shown as means ± SE (n = 6 per group) (*P<0.05 compared with antagomir-control treated mice). qRT-PCR was used to analyze α-SMA (G) and FN (H) mRNA expression levels in glomeruli of the antagomir-215-treated mice. qRT-PCR results were normalized to GAPDH. Data are shown as means ± SE (n = 6 per group) (*P<0.05 compared with antagomir-control treated mice). α-SMA (I) and FN (J) protein expression levels were detected in the glomeruli by immunohistochemical staining and western blotting, respectively. control, db/db mice treated with antagomir-control, antagomir-215, db/db mice treated with antagomir-215. Magnification, ×400 in H.

Similar articles

Cited by

References

    1. Balakumar P, Arora MK, Reddy J, Anand-Srivastava MB (2009) Pathophysiology of diabetic nephropathy: involvement of multifaceted signalling mechanism. J Cardiovasc Pharmacol 54: 129–138. - PubMed
    1. Fogo AB (1999) Mesangial matrix modulation and glomerulosclerosis. Exp Nephrol 7: 147–159. - PubMed
    1. Qian Y, Feldman E, Pennathur S, Kretzler M, Brosius FC 3rd (2008) From fibrosis to sclerosis: mechanisms of glomerulosclerosis in diabetic nephropathy. Diabetes 57: 1439–1445. - PMC - PubMed
    1. Essawy M, Soylemezoglu O, Muchaneta-Kubara EC, Shortland J, Brown CB, et al. (1997) Myofibroblasts and the progression of diabetic nephropathy. Nephrol Dial Transplant 12: 43–50. - PubMed
    1. Simonson MS (2007) Phenotypic transitions and fibrosis in diabetic nephropathy. Kidney Int 71: 846–854. - PubMed

Publication types

MeSH terms