Bartonella quintana deploys host and vector temperature-specific transcriptomes
- PMID: 23554923
- PMCID: PMC3595295
- DOI: 10.1371/journal.pone.0058773
Bartonella quintana deploys host and vector temperature-specific transcriptomes
Abstract
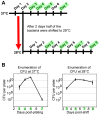
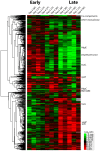
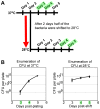
The bacterial pathogen Bartonella quintana is passed between humans by body lice. B. quintana has adapted to both the human host and body louse vector niches, producing persistent infection with high titer bacterial loads in both the host (up to 10(5) colony-forming units [CFU]/ml) and vector (more than 10(8) CFU/ml). Using a novel custom microarray platform, we analyzed bacterial transcription at temperatures corresponding to the host (37°C) and vector (28°C), to probe for temperature-specific and growth phase-specific transcriptomes. We observed that transcription of 7% (93 genes) of the B. quintana genome is modified in response to change in growth phase, and that 5% (68 genes) of the genome is temperature-responsive. Among these transcriptional changes in response to temperature shift and growth phase was the induction of known B. quintana virulence genes and several previously unannotated genes. Hemin binding proteins, secretion systems, response regulators, and genes for invasion and cell attachment were prominent among the differentially-regulated B. quintana genes. This study represents the first analysis of global transcriptional responses by B. quintana. In addition, the in vivo experiments provide novel insight into the B. quintana transcriptional program within the body louse environment. These data and approaches will facilitate study of the adaptation mechanisms employed by Bartonella during the transition between human host and arthropod vector.
Conflict of interest statement
Figures


Similar articles
-
The Bartonella quintana extracytoplasmic function sigma factor RpoE has a role in bacterial adaptation to the arthropod vector environment.J Bacteriol. 2013 Jun;195(11):2662-74. doi: 10.1128/JB.01972-12. Epub 2013 Apr 5. J Bacteriol. 2013. PMID: 23564167 Free PMC article.
-
Transcriptional regulation of the heme binding protein gene family of Bartonella quintana is accomplished by a novel promoter element and iron response regulator.Infect Immun. 2007 Sep;75(9):4373-85. doi: 10.1128/IAI.00497-07. Epub 2007 Jun 18. Infect Immun. 2007. PMID: 17576755 Free PMC article.
-
Environmental signals generate a differential and coordinated expression of the heme receptor gene family of Bartonella quintana.Infect Immun. 2006 Jun;74(6):3251-61. doi: 10.1128/IAI.00245-06. Infect Immun. 2006. PMID: 16714552 Free PMC article.
-
Bartonella (Rochalimaea) quintana infections.Clin Microbiol Rev. 1996 Jul;9(3):273-92. doi: 10.1128/CMR.9.3.273. Clin Microbiol Rev. 1996. PMID: 8809460 Free PMC article. Review.
-
Pathogenic mechanisms of Bartonella quintana.New Microbiol. 2000 Oct;23(4):449-56. New Microbiol. 2000. PMID: 11061635 Review.
Cited by
-
Iron Starvation Conditions Upregulate Ehrlichia ruminantium Type IV Secretion System, tr1 Transcription Factor and map1 Genes Family through the Master Regulatory Protein ErxR.Front Cell Infect Microbiol. 2018 Jan 19;7:535. doi: 10.3389/fcimb.2017.00535. eCollection 2017. Front Cell Infect Microbiol. 2018. PMID: 29404278 Free PMC article.
-
Comparison of transcriptomic profiles between intracellular and extracellular Bartonella henselae.Commun Biol. 2025 Jan 29;8(1):143. doi: 10.1038/s42003-025-07535-9. Commun Biol. 2025. PMID: 39881203 Free PMC article.
-
A family of genus-specific RNAs in tandem with DNA-binding proteins control expression of the badA major virulence factor gene in Bartonella henselae.Microbiologyopen. 2017 Apr;6(2):e00420. doi: 10.1002/mbo3.420. Epub 2016 Oct 28. Microbiologyopen. 2017. PMID: 27790856 Free PMC article.
-
Rapid, Sensitive Detection of Bartonella quintana by Loop-Mediated Isothermal Amplification of the groEL Gene.Int J Mol Sci. 2016 Dec 1;17(12):1902. doi: 10.3390/ijms17121902. Int J Mol Sci. 2016. PMID: 27916953 Free PMC article.
-
Assessment of vector-host-pathogen relationships using data mining and machine learning.Comput Struct Biotechnol J. 2020 Jun 25;18:1704-1721. doi: 10.1016/j.csbj.2020.06.031. eCollection 2020. Comput Struct Biotechnol J. 2020. PMID: 32670510 Free PMC article. Review.
References
-
- Greub G, Raoult D (2004) Bartonella Infections Resurgence in the New Century, In: Fong I W Drlica K, editorsEmerging Infectious Diseases of the 21st Century: Springer US.pp. 35–68.
-
- Raoult D, Roux V (1999) The body louse as a vector of reemerging human diseases. Clin Infect Dis 29: 888–911. - PubMed
-
- Vinson JW, Varela G, Molina-Pasquel C (1969) Trench fever. 3. Induction of clinical disease in volunteers inoculated with Rickettsia quintana propagated on blood agar. Am J Trop Med Hyg 18: 713–722. - PubMed
-
- Foucault C, Barrau K, Brouqui P, Raoult D (2002) Bartonella quintana Bacteremia among Homeless People. Clin Infect Dis 35: 684–689. - PubMed
Publication types
MeSH terms
Grants and funding
LinkOut - more resources
Full Text Sources
Other Literature Sources
Molecular Biology Databases

