. 2013;8(3):e58803.
doi: 10.1371/journal.pone.0058803. Epub 2013 Mar 15.

Tooth eruption results from bone remodelling driven by bite forces sensed by soft tissue dental follicles: a finite element analysis

Affiliations

Tooth eruption results from bone remodelling driven by bite forces sensed by soft tissue dental follicles: a finite element analysis

Babak Sarrafpour et al. PLoS One. 2013.

Abstract

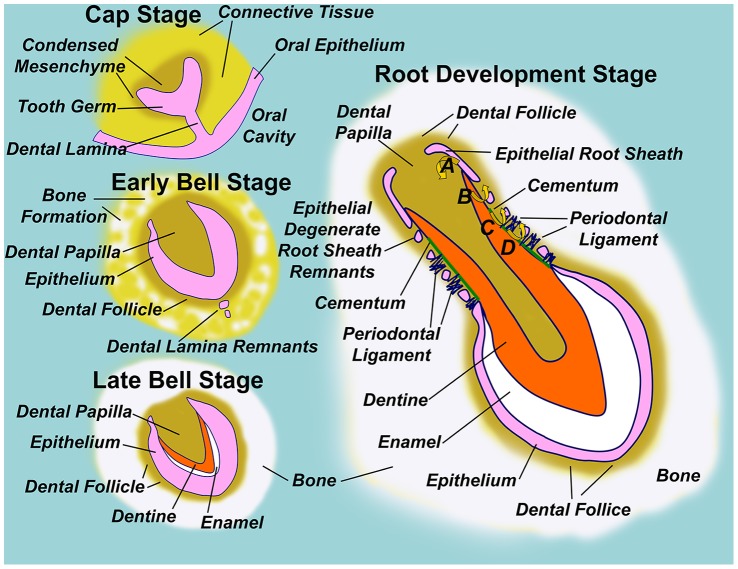
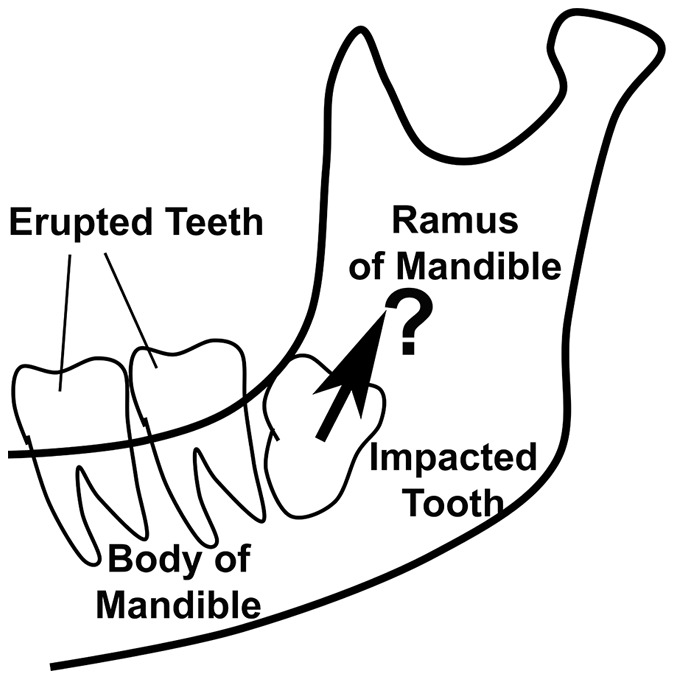
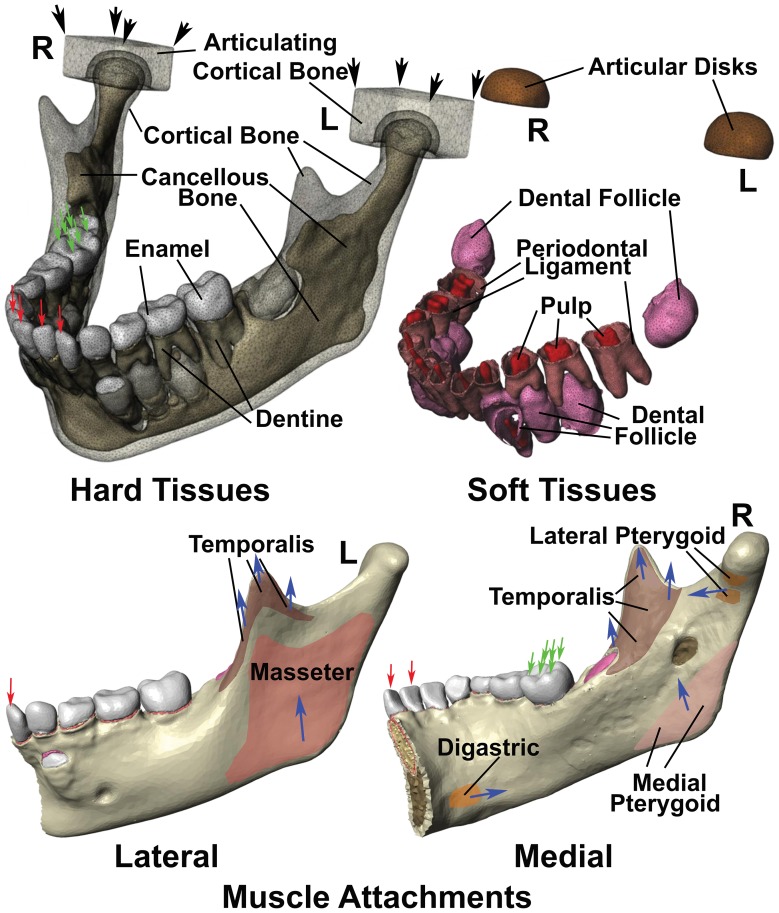
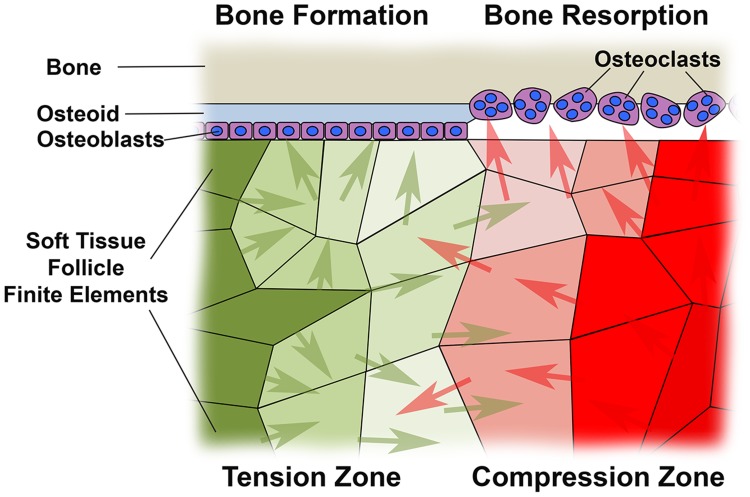
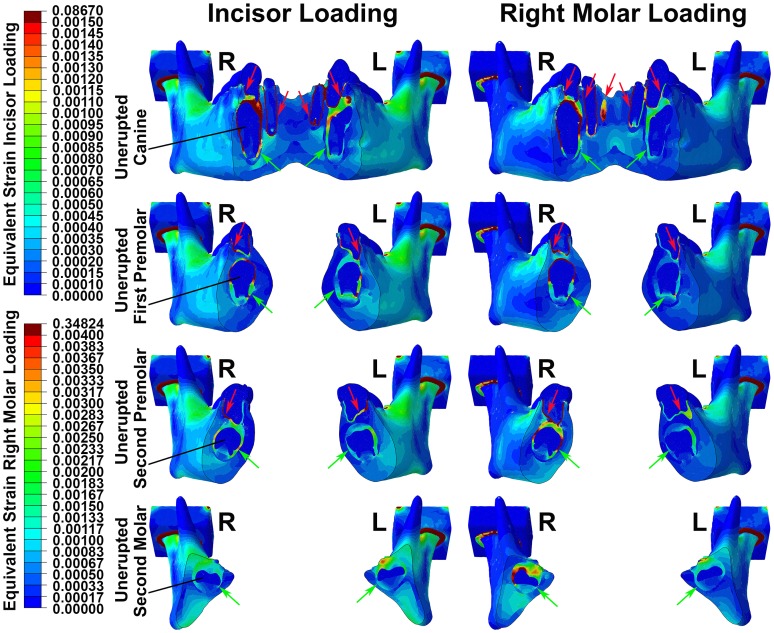
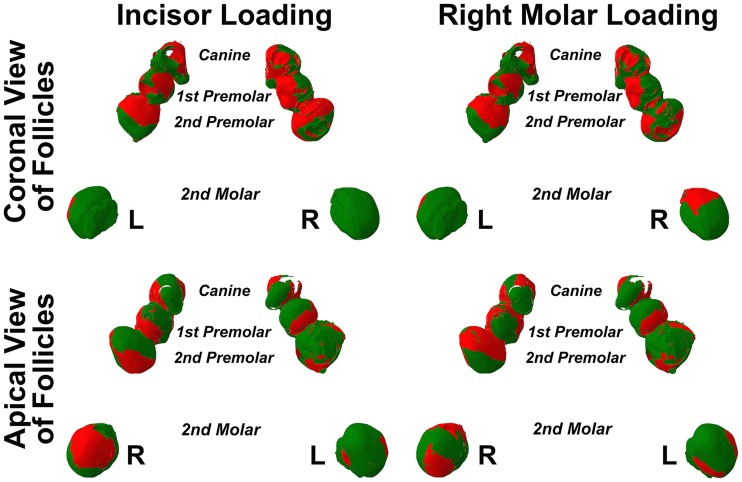
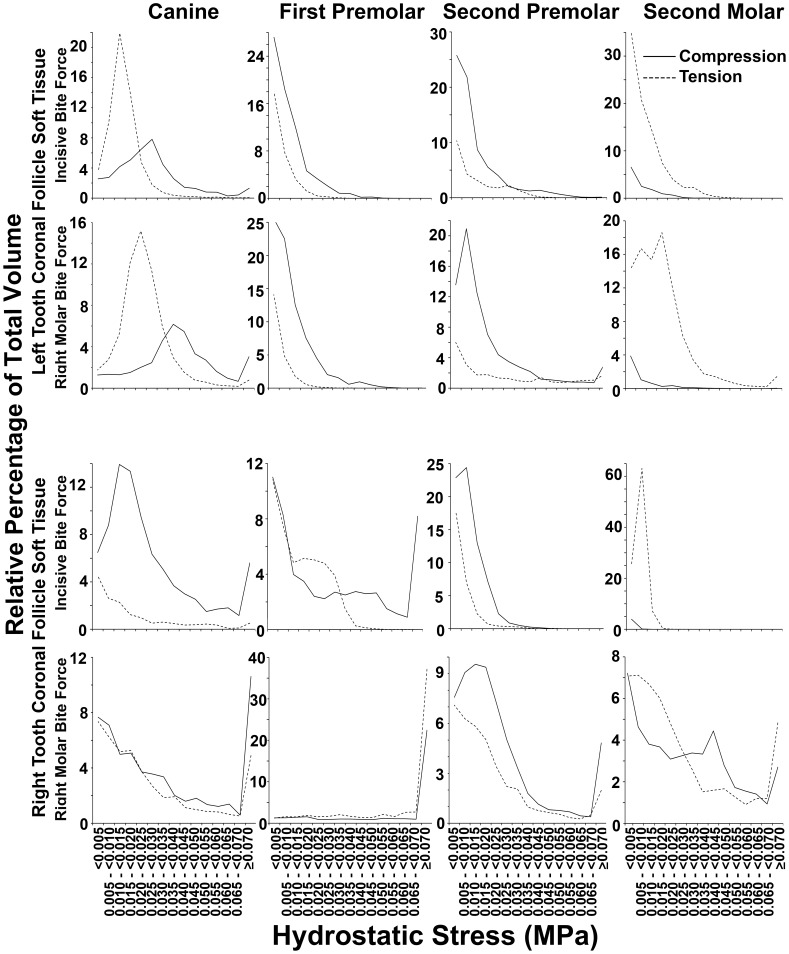
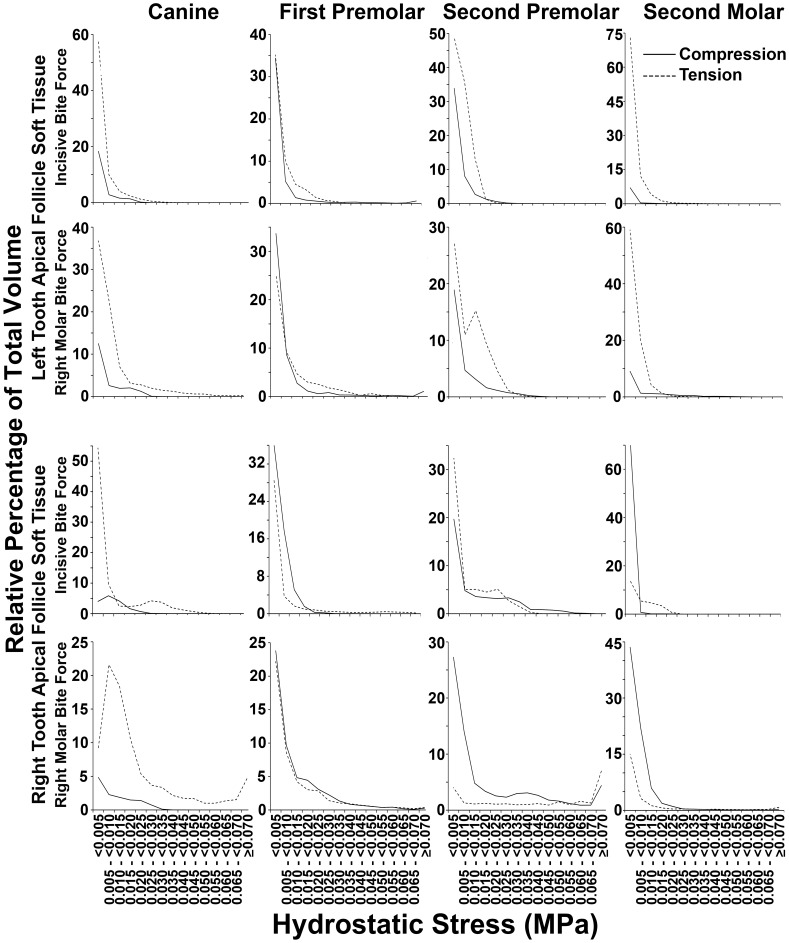
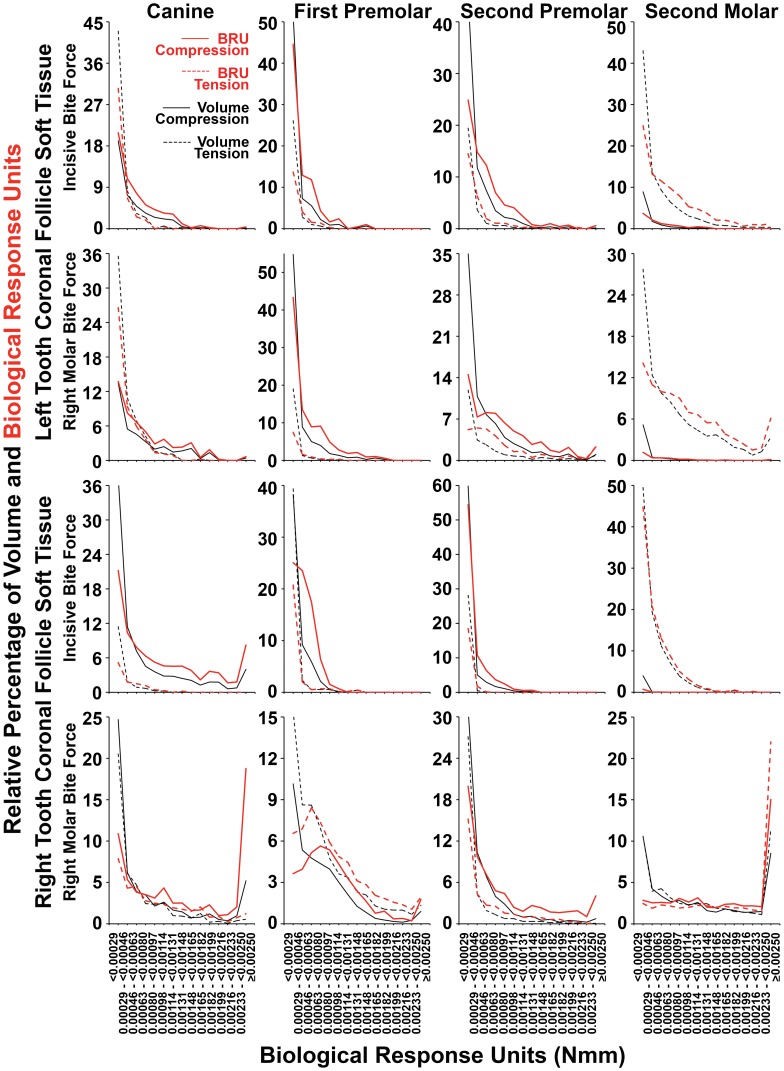
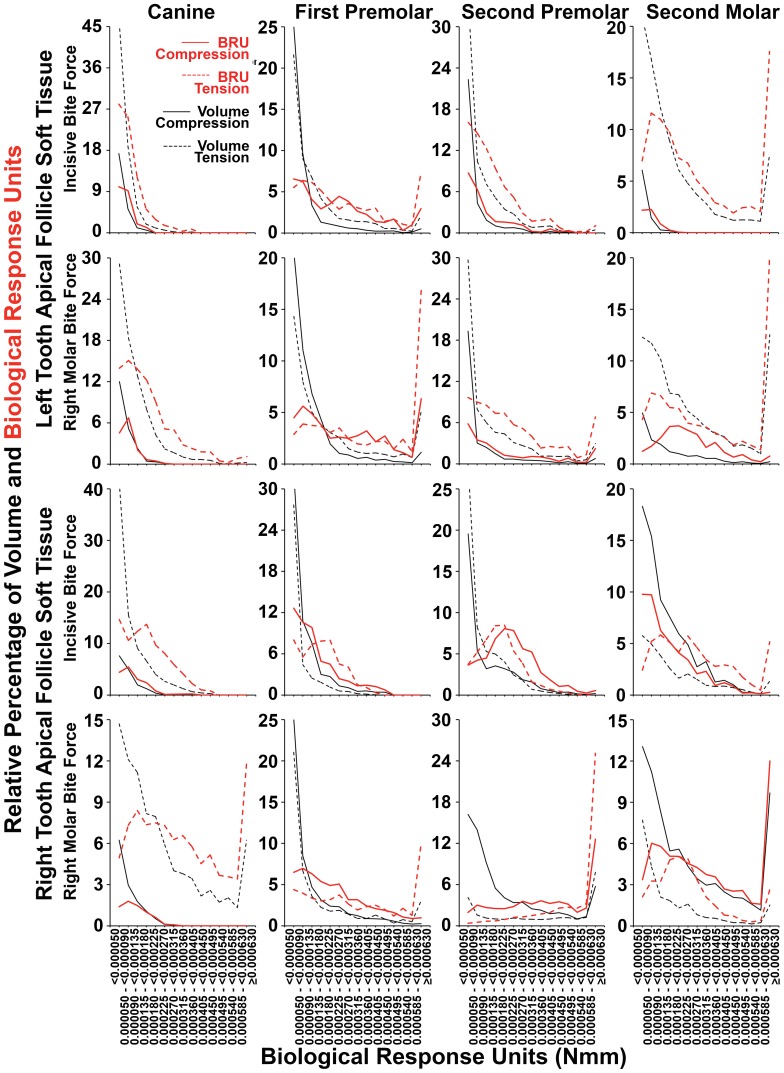
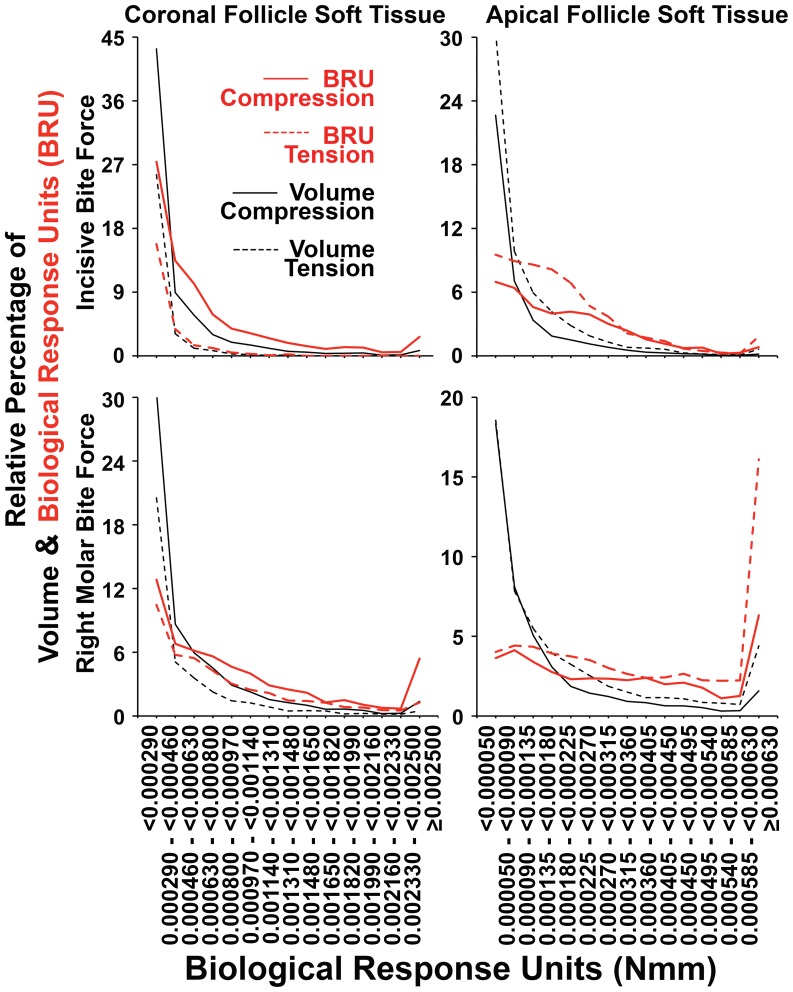
Intermittent tongue, lip and cheek forces influence precise tooth position, so we here examine the possibility that tissue remodelling driven by functional bite-force-induced jaw-strain accounts for tooth eruption. Notably, although a separate true 'eruptive force' is widely assumed, there is little direct evidence for such a force. We constructed a three dimensional finite element model from axial computerized tomography of an 8 year old child mandible containing 12 erupted and 8 unerupted teeth. Tissues modelled included: cortical bone, cancellous bone, soft tissue dental follicle, periodontal ligament, enamel, dentine, pulp and articular cartilage. Strain and hydrostatic stress during incisive and unilateral molar bite force were modelled, with force applied via medial and lateral pterygoid, temporalis, masseter and digastric muscles. Strain was maximal in the soft tissue follicle as opposed to surrounding bone, consistent with follicle as an effective mechanosensor. Initial numerical analysis of dental follicle soft tissue overlying crowns and beneath the roots of unerupted teeth was of volume and hydrostatic stress. To numerically evaluate biological significance of differing hydrostatic stress levels normalized for variable finite element volume, 'biological response units' in Nmm were defined and calculated by multiplication of hydrostatic stress and volume for each finite element. Graphical representations revealed similar overall responses for individual teeth regardless if incisive or right molar bite force was studied. There was general compression in the soft tissues over crowns of most unerupted teeth, and general tension in the soft tissues beneath roots. Not conforming to this pattern were the unerupted second molars, which do not erupt at this developmental stage. Data support a new hypothesis for tooth eruption, in which the follicular soft tissues detect bite-force-induced bone-strain, and direct bone remodelling at the inner surface of the surrounding bony crypt, with the effect of enabling tooth eruption into the mouth.


Conflict of interest statement

Competing Interests: The authors have declared that no competing interests exist.

Figures

Figure 1
Figure 1. Diagram illustrating normal tooth formation.
In the early embryo, the oral cavity is separated from underlying connective tissues by a stratified squamous epithelium. A ridge of epithelium invades connective tissue to form the dental lamina, while individual tooth germs are seen at the ‘Cap Stage’ of tooth development as ‘Dome-shaped’ thickenings in the dental lamina surrounded by condensed mesenchyme. Degeneration of the dental lamina to epithelial remnants isolates the tooth germ from the oral epithelium in the ‘Early Bell Stage’, so named because tooth germ epithelium remodels to a bell-like form, such that the inner surface defines the shape of the tooth crown and encloses condensed mesenchyme of the dental papilla, which is the future dental pulp. The dental follicle comprises condensed mesenchyme immediately surrounding the ‘bell’ epithelium, and bone begins to form surrounding the follicle. In the ‘Late Bell Stage’ of tooth development, inductive signals from the epithelium drive differentiation of dentine forming odontoblasts in the adjacent dental papilla. Progressive layers of dentine encroach on the dental papilla space, while dentine itself acts as a further inductive signal driving inner epithelial cells of the tooth germ to differentiate to enamel forming ameloblasts. Analogous to dentine, layers of enamel are deposited by ameloblasts at the expense of tooth germ epithelium, so that the tooth crown has formed by conclusion of the ‘Late Bell Stage’. Throughout, bone formation continues around the dental follicle, and the tooth germ becomes enclosed within a bony crypt embedded within the jaw. Root development is initiated by downgrowth of epithelial cells at the ‘lip of the bell’ to form an epithelial root sheath. Root sheath epithelial cells instruct dentine formation in the underlying papilla (A), and respond to the newly formed dentine by degenerating into root sheath remnants. Dentine thus becomes exposed to cells of the dental follicle, which respond by cementoblast differentiation (B). Cementoblasts then layer cementum over the exposed dentine, while cementum itself acts as a further inductive signal to cells of the follicle to form the periodontal ligament which anchors cementum to the surrounding bony crypt via dense collagen fibres (D). In this way, the root sheath defines root shape with the furthest extent of root sheath downgrowth defining the root apex, and inductive steps following root sheath degeneration establish the necessary bony attachment of teeth via the periodontal ligament –.
Figure 2
Figure 2. Diagram outlining the position of a mandibular third molar with bony impaction.
The outline of the body and ramus of the mandible is shown, as is the location of first and second molar teeth which have erupted normally into the mouth. A third molar tooth is shown, which has formed in such a way that the crown is orientated up into the ramus of the mandible rather than into the oral cavity. Despite this being a common clinical event, there are no reported cases of third molars erupting along the path indicated by the arrow. Instead, teeth with bony impaction appear to reach a stable position, from which further eruption does not proceed. We conclude that factors other than tooth orientation determine the path of tooth eruption.
Figure 3
Figure 3. Diagrams illustrating the finite element model constructed in this study.
Illustrated are the boundary conditions, as well as the muscle attachments on the lateral left and medial right surfaces of the mandible, while left (L) and right (R) joints are indicated respectively. Hard tissues modelled included cortical bone, cancellous bone, enamel and dentine. Two solid blocks with the properties of cortical bone were modelled in replacement of the base of skull. Soft tissues included dental follicle, periodontal ligaments and dental pulps, while articular disk material with the physical properties of cartilage were modelled between the mandible and articulating cortical bone blocks. The lateral surface of the mandible had only temporalis and masseter muscle attachments, while attachments for the digastric, temporalis, lateral pterygoid and medial pterygoid muscles were modelled on the medial surface. The direction of muscle force is indicated with blue arrows. The articulating cortical bone blocks were assumed fastened at the corners indicated with black arrows, while in the case of incisor biting, single fixed points were assumed at all four incisor edges (red arrows), with muscle traction generating strain within the constructed model was applied. Right molar bite force was also modelled by fixing 6 points on the outer and upper surfaces of the right first molar as indicated (green arrows), and applying muscle traction.
Figure 4
Figure 4. Diagram illustrating coronal and apical follicle segments of right-unerupted teeth for quantitative analysis.
While only the surface of each dental follicle is shown, the entire thickness of dental follicles was examined during quantitation.
Figure 5
Figure 5. Diagram illustrating the significance of ‘Biological Response Units’ as defined in this paper.
The interface between bone and dental follicle soft tissue is critical for tooth eruption, as it is only at this surface that bone is either deposited by osteoblasts as fresh osteoid, or alternatively resorbed by osteoclasts. Finite elements in soft tissue follicle are illustrated under differing levels of either tension or compression, marked with increasing intensities of green or red colour respectively. Soluble factors driving either bone formation (green arrows) or bone resorption (red arrows) are indicated as produced by cells residing in volumes described by the finite elements shown, such that where ‘green arrows’ predominate, bone deposition would occur, with bone resorption occurring where there is a preponderance of ‘red arrows’ marking resorptive factors. Cell responses to most stimuli are dose dependent, while a necessary assumption in this work is that there is a linear relationship between compression or tension quantitated in terms of hydrostatic stress in the current paper, and the amount of bone resorptive or formative soluble factor produced by cells. Finite elements vary greatly in volume, so that the number of cells and hence total quantity of bone resorptive or stimulatory soluble factors must vary in direct proportion to finite element volume. To allow for variability in finite element volume and permit meaningful quantitation of the biological impact of compression and tension across finite elements, we have multiplied the volume by hydrostatic stress within individual finite elements, and thus defined a new measure we term the ‘Biological Response Unit’.
Figure 6
Figure 6. Colour plot diagrams showing patterns of equivalent strain.
Four vertical sections of the mandible are shown, through each of the unerupted teeth during incisor loading (left side images) and right molar loading (right side images). Right (R) and left (L) joints are indicated respectively, while colour scales for incisor and molar loading images are shown separately. Irrespective of the pattern of loading applied, equivalent strain was maximal in soft tissues of the periodontal ligaments (red arrows) and dental follicles (green arrows), with generally lower levels of strain seen in hard tissues.
Figure 7
Figure 7. Dental follicle compression (red) and tension (green) during incisor or right molar bite force.
The surface of dental follicles is seen from coronal or apical perspectives, while left (L) and right (R) sides are indicated. The upper surfaces of dental follicles for unerupted canines, first premolars and second premolars appeared subject to greater compression during both incisor and right molar loading, as compared with the lower surfaces of the same teeth which were in general subject to greater tension. This general pattern did not, however, appear to apply in the case of the unerupted second molars.
Figure 8
Figure 8. Percentage distribution of coronal soft tissue follicle volume according to the range of hydrostatic stress.
Data for coronal soft tissue caps from each unerupted tooth is shown. For canines and premolars known to undergo active eruption at this stage of development, generally greater volumes had compressive (solid lines) as opposed to tensile (dashed lines) hydrostatic stress across most hydrostatic stress ranges. Tension, however, appeared more prominent in second molars which do not erupt at this stage of development. Further exceptions were in the left canine during incisive and molar bite force application, as well as in the right first premolar during right molar loading.
Figure 9
Figure 9. Percentage distribution of apical soft tissue follicle volume according to the range of hydrostatic stress.
Data for apical soft tissue caps from each unerupted tooth is shown. Generally greater volumes had tensile (dashed lines) as opposed to compressive (solid lines) hydrostatic stress across most hydrostatic stress ranges. Exceptions to this pattern were seen, however, in the right first premolar and right second molar during incisive bite force application, as well as in the two first premolars and the right second premolar and molar, during right molar force application.
Figure 10
Figure 10. Percentage distribution of coronal and apical soft tissue follicle volume according to hydrostatic stress.
Data for apical and coronal soft tissue caps, pooled separately from canines and premolars, under incisive or right molar bite force application are shown. For almost all bite force and hydrostatic stress conditions, greater volumes were devoted to compression (solid lines) in coronal follicle tissues, and to tension (dashed lines) in apical follicle tissues.
Figure 11
Figure 11. Percentage distribution of coronal follicle volume and summated BRU according BRU.
As summarized in Table 2, considering tissue volumes alone (black lines), there was a strong tendency for compression (solid black lines) to dominate over tension (dashed black lines) across most BRU ranges. This was more pronounced when summated BRU was considered (red lines), such that there was a general right shift in BRU curves for compression (red solid lines) and sometimes a corresponding left shift in BRU curves for tension (dashed red lines). Exceptions for both volume and summated BRU were seen in the second molars, as well as in the right first premolar during right molar bite force application, while there were further exceptions considering volume alone in the left canine during both incisive and right molar loading.
Figure 12
Figure 12. Percentage distribution of apical follicle volume and summated BRU according BRU.
As summarized in Table 2, considering tissue volumes alone (black lines), there was a strong tendency for tension (dashed black lines) to dominate over compression (solid black lines) across most BRU ranges. This was more pronounced when summated BRU was considered (red lines), such that there was a general right shift in BRU curves for tension (dashed solid lines) and occasionally a corresponding left shift in BRU curves for compression (solid red lines). Exceptions occurred during right molar bite force with regard to both volume and BRU in the right premolars and second molar, and in the right first premolar during incisive bite force. Compression was also more dominant in incisive bite force application considering volume alone in the right second molar, and BRU alone in the right second premolar. Similarly, compression was only slightly dominant considering volume alone in the left first premolar during right molar loading.
Figure 13
Figure 13. Pooled canine and premolar percentage distributions of follicle volume and summated BRU according BRU.
As summarized in Table 3, considering tissue volumes alone (black lines), compression (solid black lines) dominated over tension (dashed black lines) in coronal tissues, and this was reversed in apical tissues. These patterns were more pronounced when summated BRU was considered (red lines), such that there was a general right shift in BRU curves for compression in coronal tissues (solid red lines), and for tension in apical soft tissues (dashed red lines), which a less pronounced right shifting of BRU tension and compression curves in coronal and apical tissues respectively.

Similar articles

Cited by

References

    1. Koussoulakou DS, Margaritis LH, Koussoulakos SL (2009) A curriculum vitae of teeth: evolution, generation, regeneration. Int J Biol Sci 5: 226–243. - PMC - PubMed
    1. McCollum M, Sharpe PT (2001) Evolution and development of teeth. J Anat 199: 153–159. - PMC - PubMed
    1. Avery JK, Steele PF, Avery N (2001) Oral Development and Histology. Stuttgart: Thieme.
    1. Proffit WR (1978) Equilibrium theory revisited: factors influencing position of the teeth. Angle Orthod 48: 175–186. - PubMed
    1. Steedle JR, Proffit WR (1985) The pattern and control of eruptive tooth movements. Am J Orthod 87: 56–66. - PubMed

Publication types

LinkOut - more resources