

Careful selection of reference genes is required for reliable performance of RT-qPCR in human normal and cancer cell lines
- PMID: 23554992
- PMCID: PMC3598660
- DOI: 10.1371/journal.pone.0059180
Careful selection of reference genes is required for reliable performance of RT-qPCR in human normal and cancer cell lines
Abstract
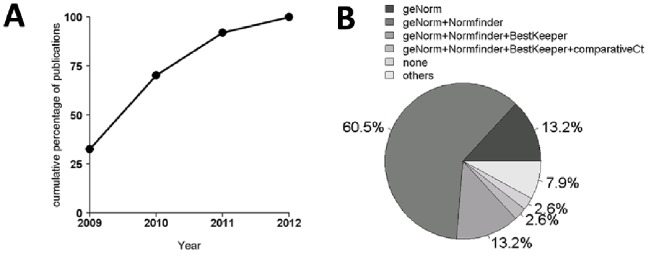
Reverse Transcription - quantitative Polymerase Chain Reaction (RT-qPCR) is a standard technique in most laboratories. The selection of reference genes is essential for data normalization and the selection of suitable reference genes remains critical. Our aim was to 1) review the literature since implementation of the MIQE guidelines in order to identify the degree of acceptance; 2) compare various algorithms in their expression stability; 3) identify a set of suitable and most reliable reference genes for a variety of human cancer cell lines. A PubMed database review was performed and publications since 2009 were selected. Twelve putative reference genes were profiled in normal and various cancer cell lines (n = 25) using 2-step RT-qPCR. Investigated reference genes were ranked according to their expression stability by five algorithms (geNorm, Normfinder, BestKeeper, comparative ΔCt, and RefFinder). Our review revealed 37 publications, with two thirds patient samples and one third cell lines. qPCR efficiency was given in 68.4% of all publications, but only 28.9% of all studies provided RNA/cDNA amount and standard curves. GeNorm and Normfinder algorithms were used in 60.5% in combination. In our selection of 25 cancer cell lines, we identified HSPCB, RRN18S, and RPS13 as the most stable expressed reference genes. In the subset of ovarian cancer cell lines, the reference genes were PPIA, RPS13 and SDHA, clearly demonstrating the necessity to select genes depending on the research focus. Moreover, a cohort of at least three suitable reference genes needs to be established in advance to the experiments, according to the guidelines. For establishing a set of reference genes for gene normalization we recommend the use of ideally three reference genes selected by at least three stability algorithms. The unfortunate lack of compliance to the MIQE guidelines reflects that these need to be further established in the research community.
Conflict of interest statement
Figures
Similar articles
-
Identification of valid reference genes for the normalization of RT-qPCR expression studies in human breast cancer cell lines treated with and without transient transfection.PLoS One. 2015 Jan 24;10(1):e0117058. doi: 10.1371/journal.pone.0117058. eCollection 2015. PLoS One. 2015. PMID: 25617865 Free PMC article.
-
The dilution effect and the importance of selecting the right internal control genes for RT-qPCR: a paradigmatic approach in fetal sheep.BMC Res Notes. 2015 Feb 27;8:58. doi: 10.1186/s13104-015-0973-7. BMC Res Notes. 2015. PMID: 25881111 Free PMC article.
-
Selection and validation of reliable reference genes for RT-qPCR analysis in a large cohort of pituitary adenomas.Mol Cell Endocrinol. 2016 Dec 5;437:183-189. doi: 10.1016/j.mce.2016.08.030. Epub 2016 Aug 22. Mol Cell Endocrinol. 2016. PMID: 27561203
-
Critical appraisal of quantitative PCR results in colorectal cancer research: can we rely on published qPCR results?Mol Oncol. 2014 Jun;8(4):813-8. doi: 10.1016/j.molonc.2013.12.016. Epub 2014 Jan 2. Mol Oncol. 2014. PMID: 24423493 Free PMC article. Review.
-
Obtaining Reliable RT-qPCR Results in Molecular Diagnostics-MIQE Goals and Pitfalls for Transcriptional Biomarker Discovery.Life (Basel). 2022 Mar 7;12(3):386. doi: 10.3390/life12030386. Life (Basel). 2022. PMID: 35330136 Free PMC article. Review.
Cited by
-
Amyloid-β(25-35) Modulates the Expression of GirK and KCNQ Channel Genes in the Hippocampus.PLoS One. 2015 Jul 28;10(7):e0134385. doi: 10.1371/journal.pone.0134385. eCollection 2015. PLoS One. 2015. PMID: 26218288 Free PMC article.
-
RNA-Seq is not required to determine stable reference genes for qPCR normalization.PLoS Comput Biol. 2022 Feb 28;18(2):e1009868. doi: 10.1371/journal.pcbi.1009868. eCollection 2022 Feb. PLoS Comput Biol. 2022. PMID: 35226660 Free PMC article.
-
Comparative mRNA/micro-RNA co-expression network drives melanomagenesis by promoting epithelial-mesenchymal transition and vasculogenic mimicry signaling.Transl Oncol. 2021 Dec;14(12):101237. doi: 10.1016/j.tranon.2021.101237. Epub 2021 Oct 6. Transl Oncol. 2021. PMID: 34626953 Free PMC article.
-
Development of reference genes for RT-qPCR analysis of gene expression in Pleurotus pulmonarius for biotechnological applications.Sci Rep. 2023 Jul 29;13(1):12296. doi: 10.1038/s41598-023-39115-4. Sci Rep. 2023. PMID: 37516784 Free PMC article.
-
Insensitive Effects of Inflammatory Cytokines on the Reference Genes of Synovial Fluid Resident-Mesenchymal Stem Cells Derived from Rheumatoid Arthritis Patients.Int J Mol Sci. 2023 Oct 13;24(20):15159. doi: 10.3390/ijms242015159. Int J Mol Sci. 2023. PMID: 37894839 Free PMC article.
References
-
- Ginzinger DG (2002) Gene quantification using real-time quantitative PCR: an emerging technology hits the mainstream. Exp Hematol 30: 503–512. - PubMed
-
- Bustin SA, Benes V, Nolan T, Pfaffl MW (2005) Quantitative real-time RT-PCR–a perspective. J Mol Endocrinol 34: 597–601. - PubMed
-
- Fleige S, Pfaffl MW (2006) RNA integrity and the effect on the real-time qRT-PCR performance. Mol Aspects Med 27: 126–139. - PubMed
-
- Bustin SA, Benes V, Garson JA, Hellemans J, Huggett J, et al. (2009) The MIQE guidelines: minimum information for publication of quantitative real-time PCR experiments. Clin Chem 55: 611–622. - PubMed
Publication types
MeSH terms
Substances
LinkOut - more resources
Full Text Sources
Other Literature Sources
Miscellaneous
