. 2013;8(3):e59182.
doi: 10.1371/journal.pone.0059182. Epub 2013 Mar 15.

Alteration of the thymic T cell repertoire by rotavirus infection is associated with delayed type 1 diabetes development in non-obese diabetic mice

Affiliations

Alteration of the thymic T cell repertoire by rotavirus infection is associated with delayed type 1 diabetes development in non-obese diabetic mice

Nicole L Webster et al. PLoS One. 2013.

Abstract

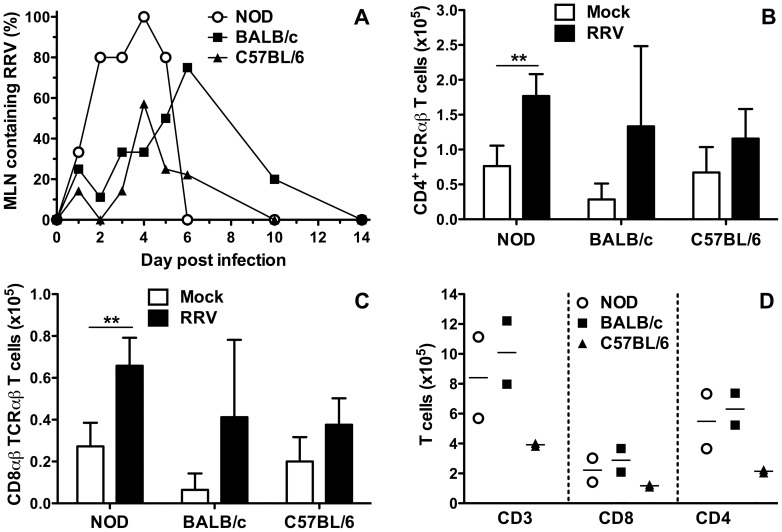
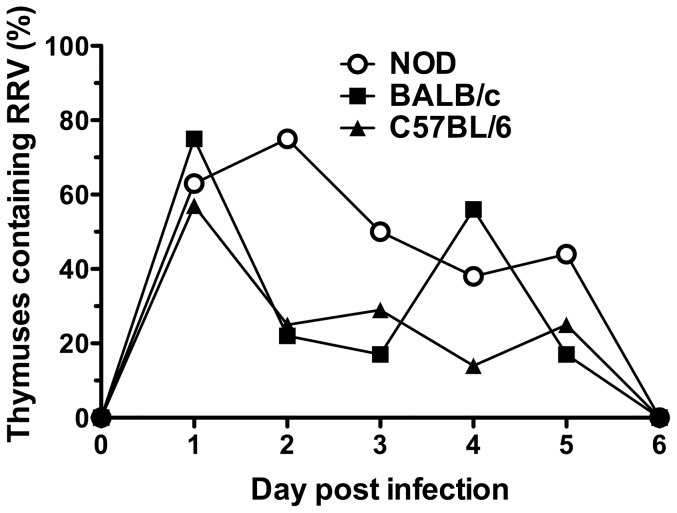
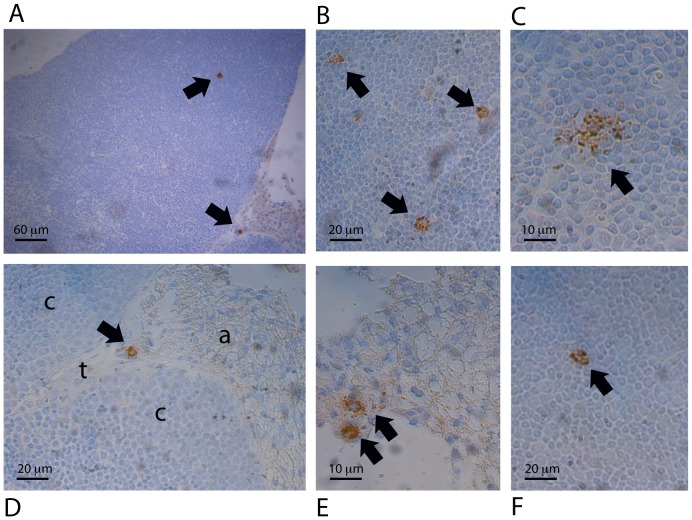
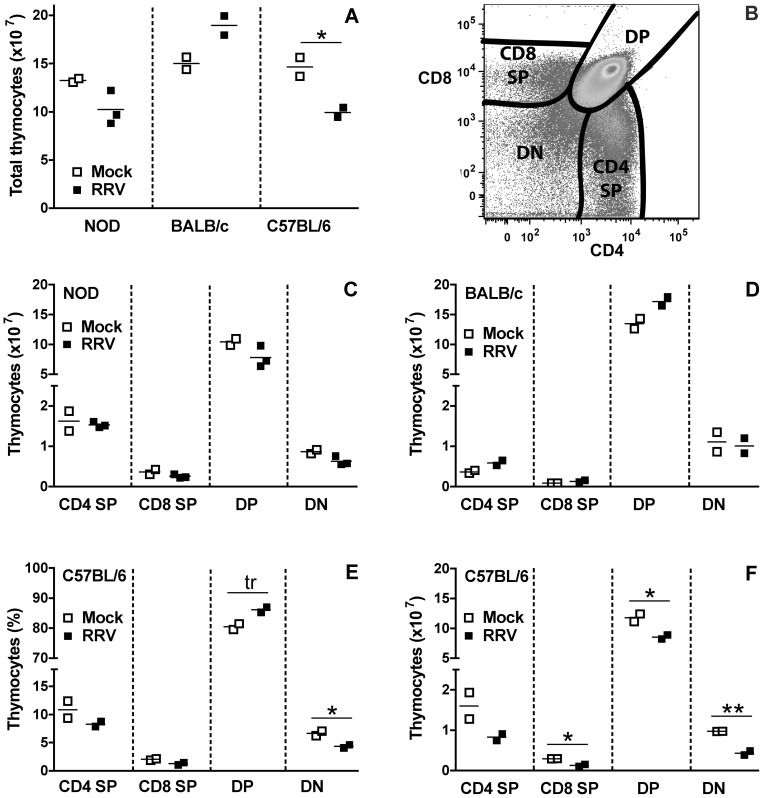
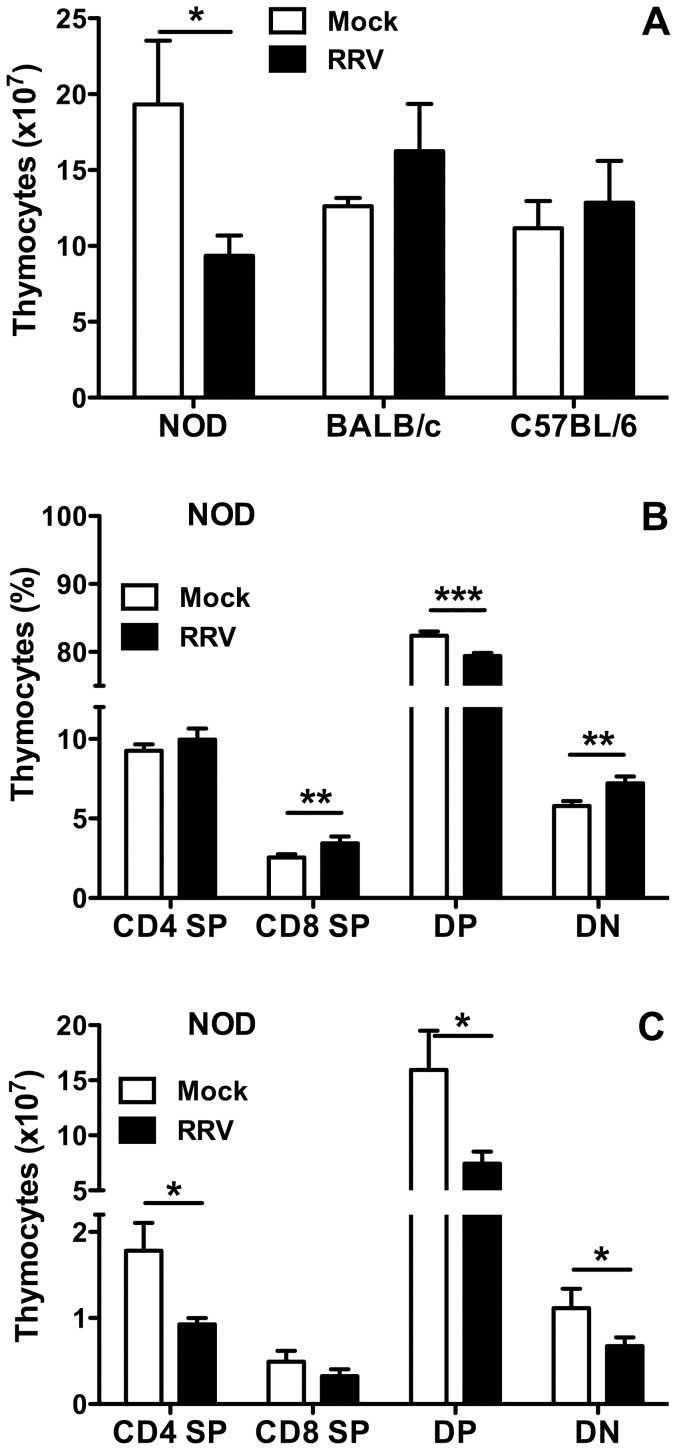
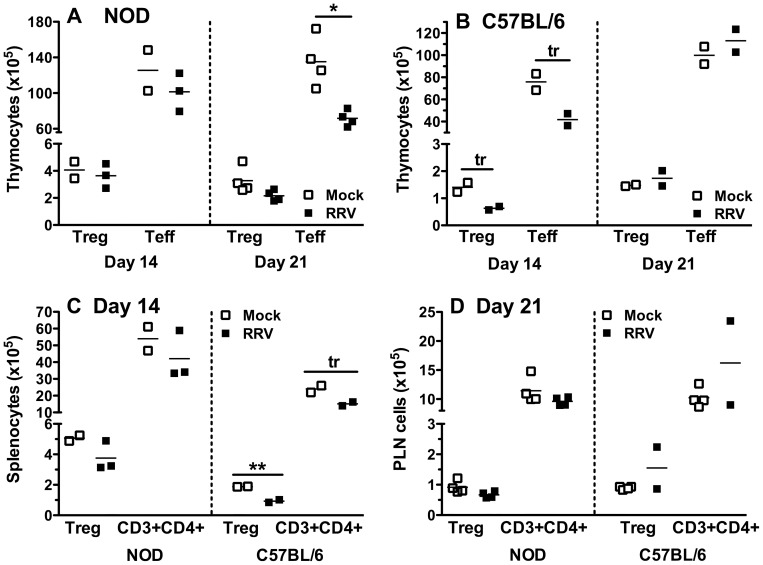
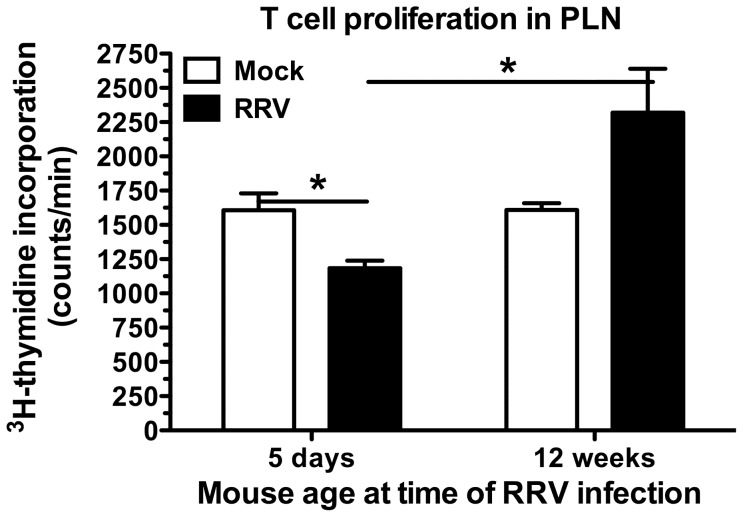
Rotaviruses are implicated as a viral trigger for the acceleration of type 1 diabetes in children. Infection of adult non-obese diabetic (NOD) mice with rotavirus strain RRV accelerates diabetes development, whereas RRV infection in infant NOD mice delays diabetes onset. In this study of infant mice, RRV titers and lymphocyte populations in the intestine, mesenteric lymph nodes (MLN) and thymus of NOD mice were compared with those in diabetes-resistant BALB/c and C57BL/6 mice. Enhanced intestinal RRV infection occurred in NOD mice compared with the other mouse strains. This was associated with increases in the frequency of CD8αβ TCRαβ intraepithelial lymphocytes, and their PD-L1 expression. Virus spread to the MLN and T cell numbers there also were greatest in NOD mice. Thymic RRV infection is shown here in all mouse strains, often in combination with alterations in T cell ontogeny. Infection lowered thymocyte numbers in infant NOD and C57BL/6 mice, whereas thymocyte production was unaltered overall in infant BALB/c mice. In the NOD mouse thymus, effector CD4(+) T cell numbers were reduced by infection, whereas regulatory T cell numbers were maintained. It is proposed that maintenance of thymic regulatory T cell numbers may contribute to the increased suppression of inflammatory T cells in response to a strong stimulus observed in pancreatic lymph nodes of adult mice infected as infants. These findings show that rotavirus replication is enhanced in diabetes-prone mice, and provide evidence that thymic T cell alterations may contribute to the delayed diabetes onset following RRV infection.


Conflict of interest statement

Competing Interests: The authors have declared that no competing interests exist.

Figures

Figure 1
Figure 1. RRV replication and IEL responses in the small intestine of RRV-infected infant mice.
A, Proportion of intestines containing infectious RRV following inoculation of 5 day-old NOD, BALB/c and C57BL/6 mice. Infectious RRV was detected by 72 h co-culture with MA104 cells followed by EIA. At each day post infection, intestines from 5 to 6 NOD mice were analysed. On days 1, 2, 3, 4, 5, 6 10 and 14 post infection, intestines from 8, 9, 6, 9, 6, 8, 5 and 6 BALB/c mice and 7, 5, 7, 7, 8, 9, 7, and 6 C57BL/6 mice were assayed, respectively. B, Frequency and C, absolute numbers of CD8αβ TCRαβ IEL on day 2 post mock- or RRV infection. To obtain sufficient cells, 4 to 6 separate cell pools were analysed for each inoculum. Each pool was produced from 2 to 5 (NOD), 2 to 3 (BALB/c) or 3 to 5 (C57BL/6) mice. Cell numbers from pools were normalized to represent cells obtained from a single mouse. D, PD-L1 expression by CD8αβ TCRαβ IEL in RRV-infected mice on days 2, 14 and 21 after infection. Data are expressed as the ratio of PD-L1 expression on cells from RRV-infected mice to the mean PD-L1 expression of mock-infected mice. The numbers of mice analysed and usage of cell pools for day 2 studies were as described for B and C. For days 14 and 21 post infection, each data point represents a pool of cells from 2 (NOD), 3 to 4 (BALB/c) or 2 to 3 (C57BL/6) mice. * p<0.05; ** p<0.01; *** p<0.001. Bar = mean.
Figure 2
Figure 2. RRV replication and T cell subsets in the MLN of RRV-infected infant mice.
A, Proportion of MLN containing infectious RRV. The numbers of mice analysed on each day are given in the Legend to Fig. 1A. Absolute numbers of CD4+ TCRαβ T cells (B) and CD8αβ TCRαβ T cells (C) at day 2 post infection are shown. To obtain sufficient cells, 4 to 5 separate cell pools were analysed for each inoculum. Each pool was produced from 4 to 5 (NOD), 3 to 4 (BALB/c) or 3 to 5 (C57BL/6) mice. Cell numbers from pools were normalized to represent cells obtained from a single mouse. D, Absolute numbers of CD3+, CD8+ and CD4+ T cells from RRV-infected mice at day 6 post infection. Each data point represents a pool of cells from 4 (NOD), 3 (BALB/c) or 3 to 4 (C57BL/6) mice. * p<0.05; ** p<0.01. Bar = mean.
Figure 3
Figure 3. Thymic infection by RRV.
On days 1, 2, 3, 4, 5 and 6 post infection, thymuses were assayed for the presence of infectious RRV by co-culture from 8, 8, 8, 8, 9 and 5 NOD mice, 8, 9, 6, 9, 6 and 8 BALB/c mice and 7, 8, 7, 7, 6 and 9 C57BL/6 mice, respectively.
Figure 4
Figure 4. Identification of macrophages as the RRV-infected cells in the thymus, and their location.
Thymus sections from 8 infants of each mouse strain were examined at the peak of thymic infection by immunohistochemistry. A, Representative section showing infected macrophages in the cortex and adipose tissue (×100). B, Three infected macrophages in the cortex (×300). (C) Infected macrophage in the cortex (×600). (D) Higher magnification (×300) image of an infected macrophage from A in the adipose tissue (a) near the trabeculae (t) and cortex region (c). (E) Two infected macrophages in the adipose tissue under the thymus capsule (×600). F, Rare infected macrophage in the cortex region of the NOD thymus (×300). All images except F are from thymuses of BALB/c mice at 4 days post infection. No cells positive for RRV were seen in matching sections stained with the negative control antibody, or in thymus sections from mock-infected mice of the same strain at the same day post-infection.
Figure 5
Figure 5. Effect of RRV on T cell populations in the thymus of mice at 14 days post infection.
A, Total number of thymocytes obtained. B, Flow cytometry gating strategy for identification of the frequency of the CD4 SP, CD8 SP, DP and DN thymyocyte subsets. The absolute number of each thymyocyte subset in NOD and BALB/c analysed in A is shown in C and D, respectively. The frequency (E) and absolute number (F) of thymyocyte subsets in C57BL/6 mice analysed in A was determined by flow cytometry gating and cell counts, respectively. For A to F, each data point indicates results from a pool of cells from 2 to 4 mice, normalized to represent cells obtained/mouse. Cell pooling was necessary to obtain sufficient cells for analysis. Bar = mean. * 0.02 ≤ p ≤ 0.04; ** p = 0.008; tr  =  trend, p = 0.05.
Figure 6
Figure 6. Effect of RRV on T cell populations in the thymus at 21 days post infection.
A, Total number of thymocytes recovered from mock- and RRV-infected mice. For each inoculum, 4 (NOD), 3 (BALB/c) and 2 (C57BL/6) individual pools of cells were analysed. Each cell pool was produced from 2 (NOD), 2 to 3 (BALB/c) or 3 to 4 (C57BL/6) mice. Cell numbers from pools were normalized to represent cells obtained/mouse. The frequency (B) and absolute number (C) of thymocytes in the CD4 SP, CD8 SP, DP and DN thymocyte populations (defined in Fig. 5B) of the NOD mice described in A was determined by flow cytometry gating and cell counts, respectively. * p<0.05; ** p<0.01; *** p<0.001.
Figure 7
Figure 7. Thymic Treg numbers were maintained in NOD mice on days 14 and 21 after infection.
Absolute numbers of thymic Treg (CD3+CD4+CD25+Foxp3+) and Teff (CD3+CD4+Foxp3) cells in NOD (A) and C57BL/6 (B) mice on days 14 and 21 post infection. Each data point indicates results from a pool of cells from 2 to 4 mice, normalized to represent cells obtained from a single mouse. C, Decreases in total CD4+ T cell (CD3+CD4+) numbers, and in the Treg subset (CD3+CD4+CD25+Foxp3+) in the spleen (C) and PLN (D) of RRV-infected NOD and C57BL/6 mice compared with controls at days 14 (C) and 21 (D) post infection. Each data point represents a pool of cells from 4 to 5 mice, normalized to represent cells/mouse. Greater numbers of PLN cell pools than thymocyte and splenocyte pools were analysed from C57BL/6 mice, due to PLN availability from other studies. Bar = mean. * p = 0.02; ** p = 0.008; tr  =  trend, 0.05≤p≤0.06.
Figure 8
Figure 8. Reduced T cell proliferation by PLN cells from adult NOD mice infected as infants.
PLN cells from groups of age-matched mice, which had been mock- or RRV-infected either as infants (5 days of age) or adults (12 weeks of age), were harvested at 17 weeks of age. Equivalent numbers of cells from mice in each group were stimulated with antibodies to CD3 and CD28. T cell proliferation was measured by 3H-thymidine incorporation (counts/min). Data for 4×10⁵ cells/well are shown. A pool of cells from 4 (infected as infant) or 5 (infected as adult) mice was analysed in triplicate for each inoculum. * p<0.05.

Similar articles

Cited by

References

    1. Glass RI, Parashar UD, Bresee JS, Turcios R, Fischer TK, et al. (2006) Rotavirus vaccines: current prospects and future challenges. Lancet 368: 323–332. - PubMed
    1. Maclaren N, Lan M, Coutant R, Schatz D, Silverstein J, et al. (1999) Only multiple autoantibodies to islet cells (ICA), insulin, GAD65, IA-2 and IA-2beta predict immune-mediated (Type 1) diabetes in relatives. J Autoimmun 12: 279–287. - PubMed
    1. Barker JM, Barriga KJ, Yu L, Miao D, Erlich HA, et al. (2004) Prediction of autoantibody positivity and progression to type 1 diabetes: Diabetes Autoimmunity Study in the Young (DAISY). J Clin Endocrinol Metab 89: 3896–3902. - PubMed
    1. Honeyman MC, Coulson BS, Stone NL, Gellert SA, Goldwater PN, et al. (2000) Association between rotavirus infection and pancreatic islet autoimmunity in children at risk of developing type 1 diabetes. Diabetes 49: 1319–1324. - PubMed
    1. Lehuen A, Diana J, Zaccone P, Cooke A (2010) Immune cell crosstalk in type 1 diabetes. Nat Rev Immunol 10: 501–513. - PubMed

Publication types

MeSH terms

Substances