. 2013;8(3):e59302.
doi: 10.1371/journal.pone.0059302. Epub 2013 Mar 15.

Complementary role of HCV and HIV in T-cell activation and exhaustion in HIV/HCV coinfection

Affiliations

Complementary role of HCV and HIV in T-cell activation and exhaustion in HIV/HCV coinfection

Thijs Feuth et al. PLoS One. 2013.

Abstract

Objectives: To investigate whether T-cell activation and exhaustion is linked to HCV- and HIV disease parameters in HIV/HCV infected individuals, we studied T-cell characteristics in HIV/HCV coinfected patients and controls.

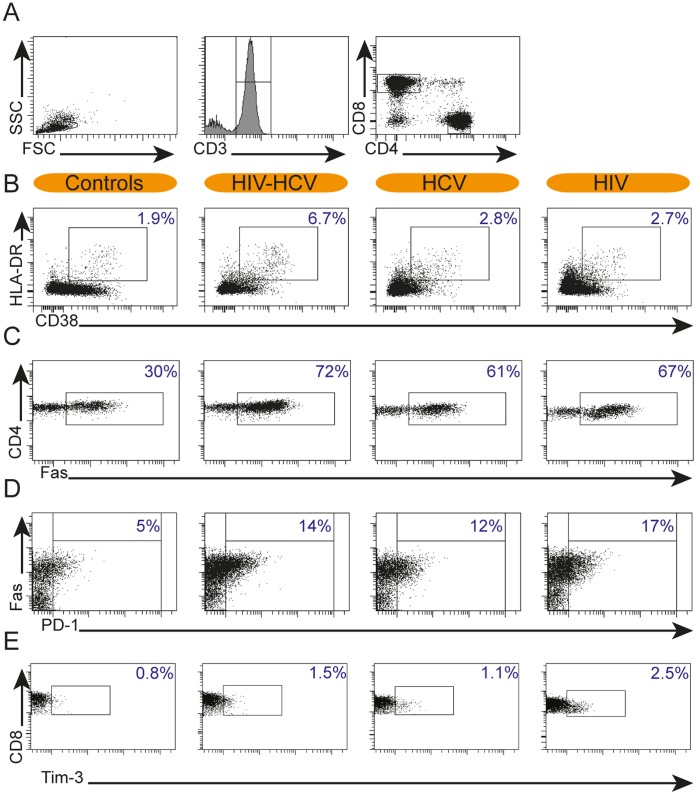
Methods: 14 HIV/HCV coinfected, 19 HCV monoinfected, 10 HIV monoinfected patients and 15 healthy controls were included in this cross-sectional study. Differences in expression of activation and exhaustion markers (HLA-DR, CD38, PD-1, Tim-3 and Fas) and phenotypic markers on CD4(+) and CD8(+) T-cells were analysed by flow cytometry and were related to HCV disease parameters (HCV-viremia, ALT and liver fibrosis).

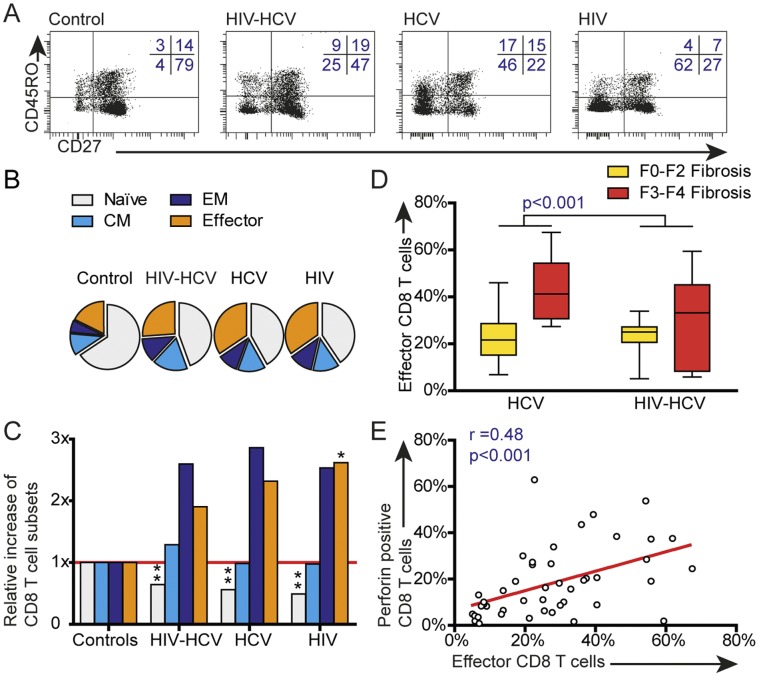
Results: Frequencies of activated CD4(+) and CD8(+) T-cells were higher in HIV/HCV-coinfected compared to healthy controls and HCV or HIV mono-infected individuals. Coinfected patients also showed high expression of the exhaustion marker PD-1 and death receptor Fas. In contrast, the exhaustion marker Tim-3 was only elevated in HIV-monoinfected patients. T-cell activation and exhaustion were correlated with HCV-RNA, suggesting that viral antigen influences T-cell activation and exhaustion. Interestingly, increased percentages of effector CD8(+) T-cells were found in patients with severe (F3-F4) liver fibrosis compared to those with no to minimal fibrosis (F0-F2).

Conclusions: HIV/HCV coinfected patients display a high level of T-cell activation and exhaustion in the peripheral blood. Our data suggest that T-cell activation and exhaustion are influenced by the level of HCV viremia. Furthermore, high percentages of cytotoxic/effector CD8(+) T-cells are associated with liver fibrosis in both HCV monoinfected and HIV/HCV coinfected patients.


Conflict of interest statement

Competing Interests: The authors have declared that no competing interests exist.

Figures

Figure 1
Figure 1. Representative flow cytometry plots.
Representative flow cytometry plots of T-cell activation- and exhaustion markers in HIV-HCV coinfected patients, HCV mono- and HIV mono-infected patients and healthy controls. A: gating of CD4+ and CD8+ T-cells by lymphocyte-gate (left panel), CD3-gate (middle panel) and gates for CD4+ or CD8+ T-cells (right panel). B-E: representative flow cytometry plots of a healthy control (left), HIV-HCV coinfected (middle left), HCV monoinfected (middle right) and HIV -monoinfected patient (right) showing (B) activated CD8+ T-cells; (C) Fas-positive CD4+ T-cells; (D) PD-1 positive CD4+ T-cells and (E) Tim-3 positive CD8+ T cells. Percentages are depicted in the right upper corner.
Figure 2
Figure 2. T-cell activation and exhaustion and its correlations with HCV-RNA in HIV/HCV-coinfection and control groups.
A: percentages of HLA-DR+CD38+ activated CD4+ (left) and CD8+ T-cells (right). B: percentages of PD-1 positive CD4+ and CD8+ T-cells. C: percentages of Tim3-positive CD4+ and CD8+ T-cells. D: percentage of death receptor Fas positive CD4+ and CD8+ T cells. E-H: correlations of HCV viral load within HIV-HCV coinfected (open dots) and HCV monoinfected patients (closed dots) with percentages of HLA-DR and CD38 positive CD8 T cells (E); PD-1 positive CD8 T cells (F); Tim-3 positive CD8 T cells (G) and Fas positive CD8 T cells (H). HCV viral loads are depicted in IU/mL. P-values are indicated with * (p<0.05), ** (p<0.01) or *** (p<0.0001). Spearman r and p-value of correlations are depicted in the upper left corner of each graph; red lines represent semilog fit lines.
Figure 3
Figure 3. Changes in CD8+ effector and memory phenotype in all patients and healthy controls.
A: representative plots of a healthy control, HIV-HCV coinfected, HCV monoinfected and HIV- mono patient showing naïve (right lower quadrant), central memory (right upper quadrant), effector memory (left upper quadrant) and effector (left lower quadrant) CD8+ T-cells by CD27 and CD45RO staining. B: pie charts of mean percentages of naïve (light grey), central memory (CM; light blue), effector memory (EM; dark blue) and effector (orange) CD8+ T-cells in 42 patients and 3 healthy controls. C: relative increase of median percentages of memory subsets compared to healthy controls. D: box plot showing percentages of effector CD8+ T-cells in HCV-monoinfected (left) or HIV/HCV-coinfected patients (right) with fibrosis scores F0–F2 (yellow) versus F3–F4 (red). The depicted p-value was calculated with two way ANOVA and indicates statistical significant difference in percentages of effector CD8+ T cells in F0–F2 fibrosis compared to F3–F4 fibrosis, independent of coinfection with HIV. Liver fibrosis was assessed with Fibroscan in 74% of HCV monoinfected patients and 71% of HIV/HCV coinfected patients. E: correlation of staining for perforin (Y-axis) with effector phenotype (X-axis) in CD8+ T-cells. Box-plots show median, quartiles and range. Line represents linear regression. P-values are depicted as: * (<0.05) and ** (p-value <0.01).

References

    1. Sherman KE, O’Brien J, Gutierrez AG, Harrison S, Urdea M, et al. (1993) Quantitative evaluation of hepatitis C virus RNA in patients with concurrent human immunodeficiency virus infections. J Clin Microbiol 31: 2679–2682. - PMC - PubMed
    1. Bonacini M, Govindarajan S, Blatt LM, Schmid P, Conrad A, et al. (1999) Patients co-infected with human immunodeficiency virus and hepatitis C virus demonstrate higher levels of hepatic HCV RNA. J Viral Hepat 6: 203–208. - PubMed
    1. Koziel MJ, Peters MG (2007) Viral hepatitis in HIV infection. N Engl J Med 356: 1445–1454. - PMC - PubMed
    1. Capa L, Soriano V, Garcia-Samaniego J, Nunez M, Romero M, et al. (2007) Influence of HCV genotype and co-infection with human immunodeficiency virus on CD4(+) and CD8(+) T-cell responses to hepatitis C virus. J Med Virol 79: 503–510. - PubMed
    1. Dutoit V, Ciuffreda D, Comte D, Gonvers JJ, Pantaleo G (2005) Differences in HCV-specific T cell responses between chronic HCV infection and HIV/HCV co-infection. Eur J Immunol 35: 3493–3504. - PubMed

MeSH terms