. 2013;8(3):e59354.
doi: 10.1371/journal.pone.0059354. Epub 2013 Mar 12.

CD106 identifies a subpopulation of mesenchymal stem cells with unique immunomodulatory properties

Affiliations

CD106 identifies a subpopulation of mesenchymal stem cells with unique immunomodulatory properties

Zhou Xin Yang et al. PLoS One. 2013.

Abstract

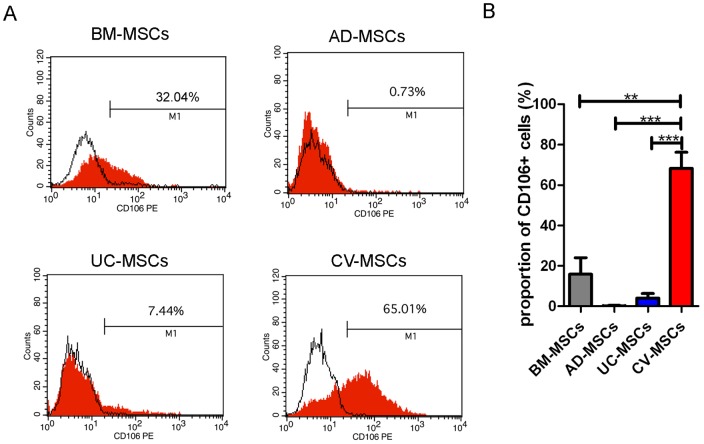
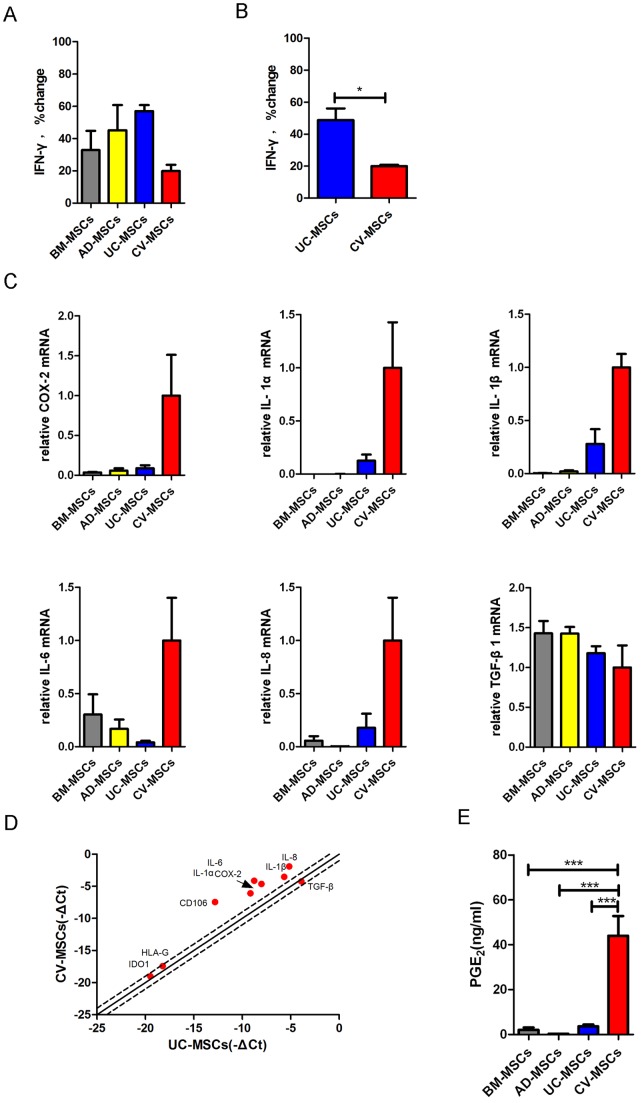
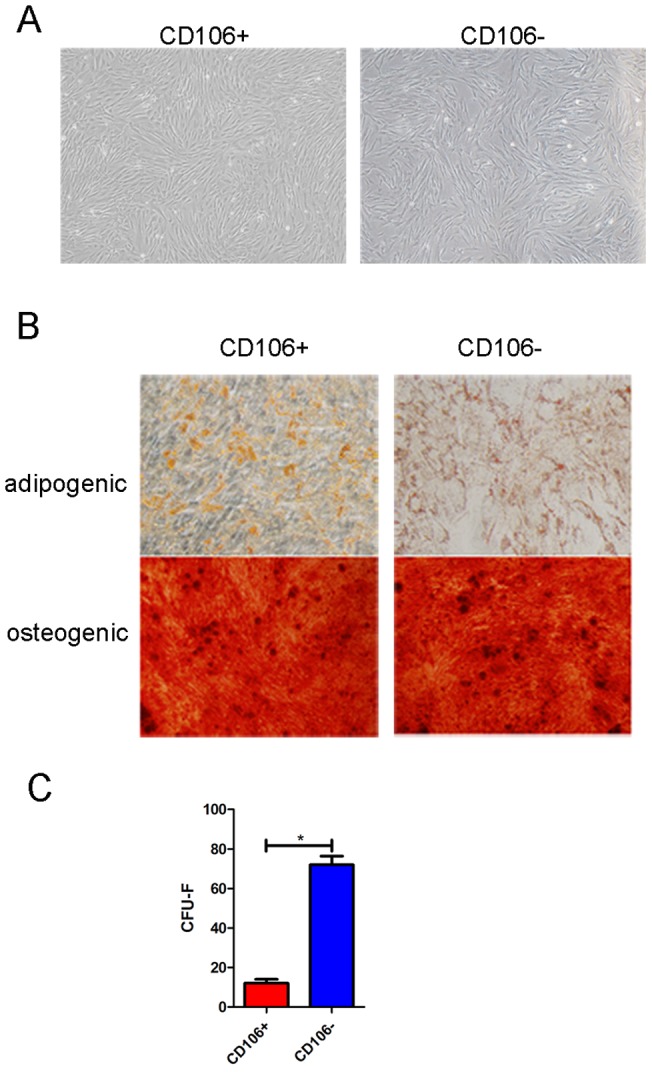
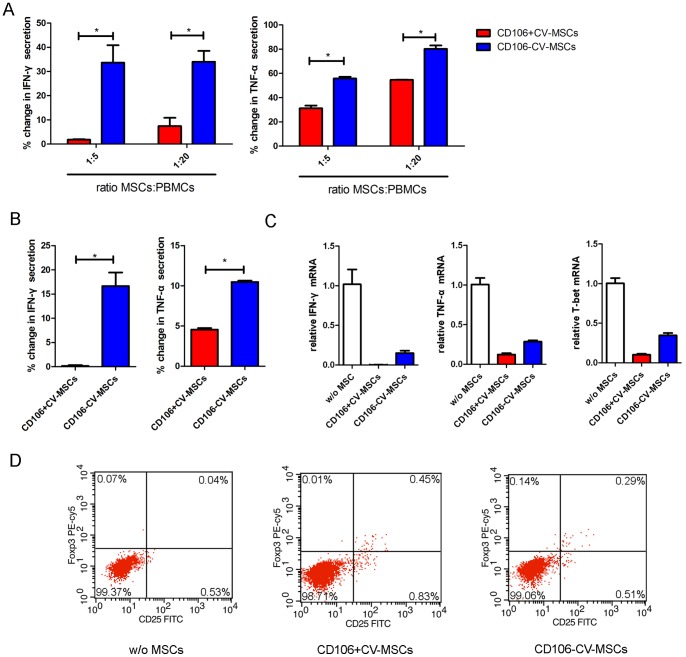
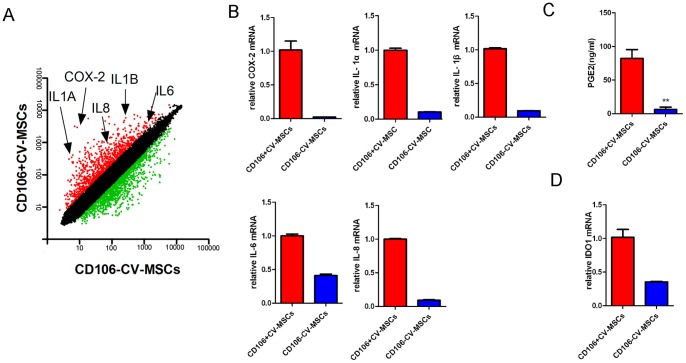
Mesenchymal stem cells (MSCs) reside in almost all of the body tissues, where they undergo self-renewal and multi-lineage differentiation. MSCs derived from different tissues share many similarities but also show some differences in term of biological properties. We aim to search for significant differences among various sources of MSCs and to explore their implications in physiopathology and clinical translation. We compared the phenotype and biological properties among different MSCs isolated from human term placental chorionic villi (CV), umbilical cord (UC), adult bone marrow (BM) and adipose (AD). We found that CD106 (VCAM-1) was expressed highest on the CV-MSCs, moderately on BM-MSCs, lightly on UC-MSCs and absent on AD-MSCs. CV-MSCs also showed unique immune-associated gene expression and immunomodulation. We thus separated CD106(+)cells and CD106(-)cells from CV-MSCs and compared their biological activities. Both two subpopulations were capable of osteogenic and adipogenic differentiation while CD106(+)CV-MSCs were more effective to modulate T helper subsets but possessed decreased colony formation capacity. In addition, CD106(+)CV-MSCs expressed more cytokines than CD106(-)CV-MSCs. These data demonstrate that CD106 identifies a subpopulation of CV-MSCs with unique immunoregulatory activity and reveal a previously unrecognized mechanism underlying immunomodulation of MSCs.


Conflict of interest statement

Competing Interests: The authors have declared that no competing interests exist.

Figures

Figure 1
Figure 1. Comparison of CD106 expression in BM-MSCs, AD-MSCs, UC-MSCs and CV-MSCs. Cells of passage 3 were used.
(A) FACS profiles of typical MSCs from different origins. (B) Statistic result of CD106 expression in different MSCs. Each type of MSCs was tested for 3 donors. (**p<0.01; ***p<0.001).
Figure 2
Figure 2. Comparison of different gene expression in BM-MSCs, AD-MSCs, UC-MSCs and CV-MSCs.
(A) BM-MSCs, AD-MSCs, UC-MSCs and CV-MSCs were co-cultured with PHA (10 μg/ml) stimulated PBMCs for 72 hours. 105 PBMCs and 2×10⁴ MSCs were added to a well of 96 well plates. IFN-γ production of activated-PBMCs was evaluated by ELISA. Percentage change of IFN-γ was gained by direct comparison to the control (activated PBMCs alone). (B) UC-MSCs and CV-MSCs from the same individuals were co-cultured with PHA stimulated PBMCs for 72 hours. A corresponding set of MSCs was tested. IFN-γ concentration in culture medium was measured by ELISA. Percentage change of IFN-γ was gained by direct comparison to the control (activated PBMCs alone). The results are presented as mean±SEM of single experiment, and the experiment have been performed at least in triplicate (*p<0.05), 3 donor samples were used. (C) Relative mRNA expression of COX-2, IL-1α, IL-1β, IL-6, IL-8 and TGF-β1 in BM-MSCs, AD-MSCs, UC-MSCs and CV-MSCs. Cells of passages 3 from 3 donors were used, respectively. (D) RT-PCR array results of immune related genes in UC-MSCs and CV-MSCs (from the same individual). –ΔCt (cycle threshold) were compared and shown in a scatter plot. (E) PGE2 concentration in culture medium of BM-MSCs, AD-MSCs, UC-MSCs and CV-MSCs after 72 hours culturing. The original seeding number is 105/well of 6 well plates. Supernatant were obtained 72 hours later. Cells of passages 3 were used (from 3 donors) (***p<0.001).
Figure 3
Figure 3. Isolation of CD106+cells and CD106cells from CV-MSCs. Image for morphology and differentiation of MSCs were taken by OLYMPUS DP72.
(A) Morphology of CD106+ and CD106 cells from CV-MSCs. (B) Differentiation potential of CD106+ and CD106 cells from CV-MSCs. Alizarin red S staining for osteogenic differentiation and oil red O staining for adipogenic differentiation. (C) Colony formation ability of CD106+ and CD106 cells from CV-MSCs. The number of CFU-F was counted after 14 days culture (*p<0.05).
Figure 4
Figure 4. Immune modulation of CD106+CV-MSC sand CD106CV-MSCs.
(A) CD106+ or CD106 CV-MSCs were co-cultured with PHA (10 μg/ml) stimulated PBMCs for 72 hours at a ratio of 1∶5 or 1∶20. IFN-γ and TNF-α production of activated-PBMCs were evaluated in co-culture medium by ELISA. Percentage change of IFN-γ and TNF-α was gained by direct comparison to the control (activated PBMCs alone). Data represent the mean of single experiment, each performed in at least triplicate (*p<0.05). (B) CD106+ or CD106 CV-MSCs were co-cultured with cord blood CD4+T cells at a ratio of 1∶10 for 72 hours stimulated with PHA and IL2. IFN-γ and TNF-α production in the supernatant were measured by ELISA. Percentage change of IFN-γ and TNF-α was gained by direct comparison to the control (activated cord blood CD4+T cells alone), each performed in at least triplicate (*p<0.05). (C) CD106+ or CD106 CV-MSCs were co-cultured with cord blood CD4+T cells at a ratio of 1∶10 for 72 hours stimulated with PHA and IL2. The relative expressions of IFN-γ, TNF-α and T-bet were measured by realtime PCR. (D) CD106+ or CD106 CV-MSCs were co-cultured with cord blood CD4+T cells at a ratio of 1∶10 for 72 hours stimulated with IL2. In flow cytometric analysis, cells were gated for CD4+ cells, and CD25 Foxp3 double positive cells were define as Tregs. Data represent a single experiment, each performed in triplicate.
Figure 5
Figure 5. Gene expressions of CD106+ and CD106 CV-MSCs.
(A) The gene expression profile of CD106+ and CD106CV-MSCs were determined using Affymetrix oligoarrays and the scatter plot shows the gene expression level. Red plots indicate genes up regulated in CD106+CV-MSCs, and green plots indicate genes up regulated in CD106CV-MSCs. (B) Relative mRNA expressions of COX-2, IL-1α, IL-1β, IL-6 and IL-8 in CD106+ and CD106CV-MSCs were determined by real-time PCR. (C) 105 of CD106+ or CD106 CV-MSCs were cultured for 72 hours and PGE2 concentration in supernatant was measured by ELISA. (D) CD106+ or CD106 CV-MSCs were cultured with IFN-γ for 24 hours and relative mRNA expressions of IDO1 were determined by real-time PCR. The results are presented as means ± SEM of three separate experiments.
Figure 6
Figure 6. Gene expressions of CV-MSCs changed by passages.
(A) CD106 expressions in CV-MSCs were detected by flow cytometry. Passages 3, 6, 9 were used. (B) Relative mRNA expressions of CD106, COX-2, IL-1α, IL-1β, IL-6 and IL-8 in CV-MSCs were determined by real-time PCR. Passage 3 and passage 9 were used. (C) 105 of CV-MSCs were cultured for 72 hours and PGE2 concentration in supernatant was measured by ELISA. Passage 3 and passage 9 were used. The results are presented as means ± SEM of three separate experiments.
Figure 7
Figure 7. Pro-inflammatory cytokines TNF-α and IL-1β could induce CD106CV-MSCs to up regulate CD106+CV-MSCs associate genes.
CD106CV-MSCs were cultured with IFN-γ (30 ng/ml), IL-1β (10 ng/ml) or TNF-α (30 ng/ml) for 24 hours respectively. The cells were collected after stimulation, and relative mRNA expressions of CD106, COX-2, IL-1α, IL-1β, IL-6 and IL-8 were measured by real-time PCR. CD106CV-MSCs cultured without pro-inflammatory cytokines were used as the controls. The results are presented as means ± SEM of three separate experiments.

References

    1. Le Blanc K, Rasmusson I, Sundberg B, Gotherstrom C, Hassan M, et al. (2004) Treatment of severe acute graft-versus-host disease with third party haploidentical mesenchymal stem cells. Lancet 363: 1439–1441. - PubMed
    1. Zappia E, Casazza S, Pedemonte E, Benvenuto F, Bonanni I, et al. (2005) Mesenchymal stem cells ameliorate experimental autoimmune encephalomyelitis inducing T-cell anergy. Blood 106: 1755–1761. - PubMed
    1. Kolf CM, Cho E, Tuan RS (2007) Mesenchymal stromal cells. Biology of adult mesenchymal stem cells: regulation of niche, self-renewal and differentiation. Arthritis Res Ther 9: 204. - PMC - PubMed
    1. Pittenger MF, Mackay AM, Beck SC, Jaiswal RK, Douglas R, et al. (1999) Multilineage potential of adult human mesenchymal stem cells. Science 284: 143–147. - PubMed
    1. Zuk PA, Zhu M, Mizuno H, Huang J, Futrell JW, et al. (2001) Multilineage cells from human adipose tissue: implications for cell-based therapies. Tissue Eng 7: 211–228. - PubMed

Publication types

MeSH terms