

Assessment of definitions of sustained disease progression in relapsing-remitting multiple sclerosis
- PMID: 23555057
- PMCID: PMC3608311
- DOI: 10.1155/2013/189624
Assessment of definitions of sustained disease progression in relapsing-remitting multiple sclerosis
Abstract
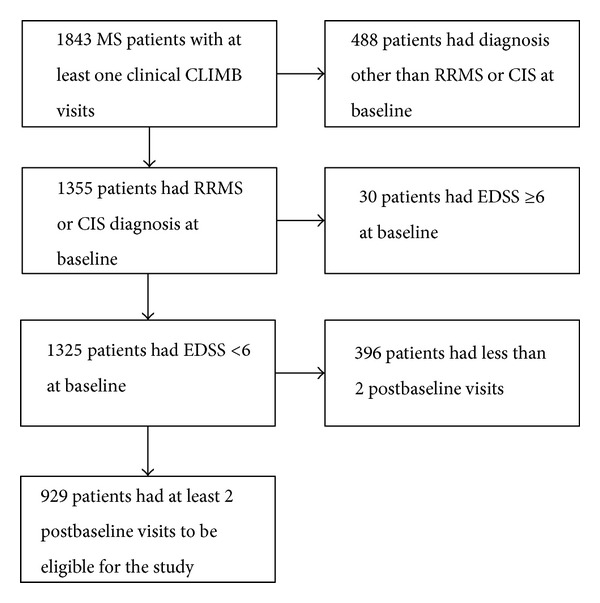
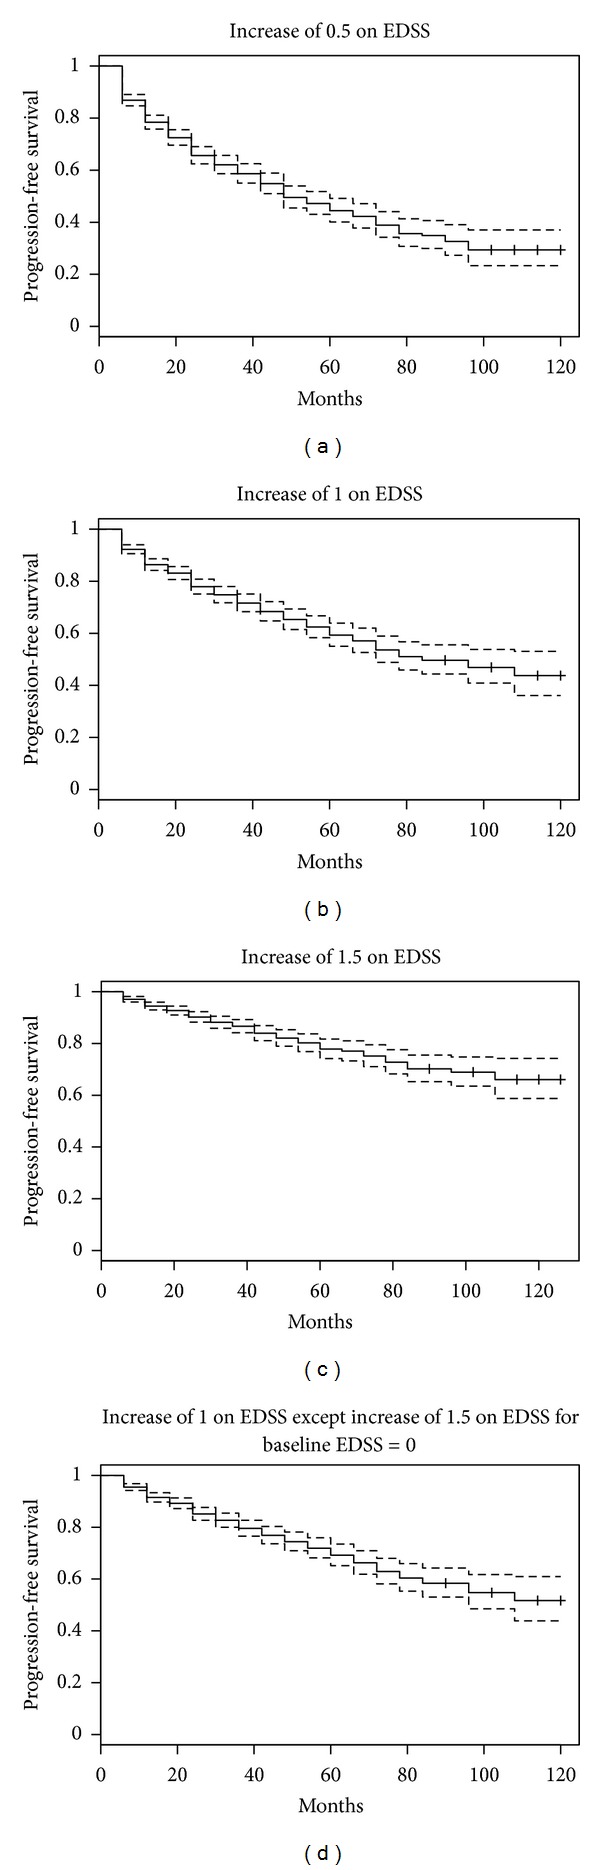
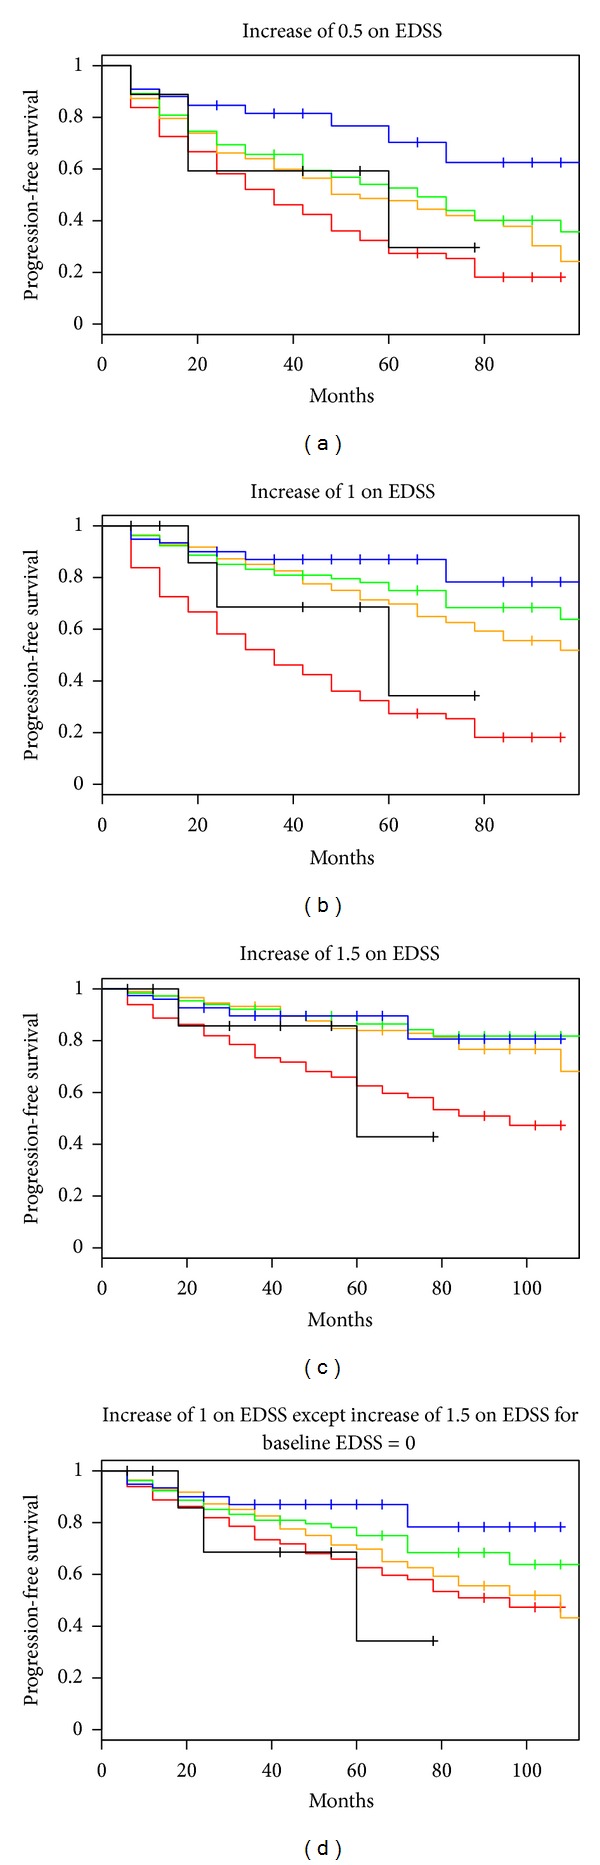
Sustained progression on the expanded disability status scale (EDSS) is a common outcome measure of disease progression in clinical studies of MS. Unfortunately, this outcome may not accurately measure long-term and irreversible disease progression. To assess the performance of definitions of sustained progression, patients with relapsing-remitting MS (RRMS) or a clinically isolated syndrome with evidence of lesions on a brain MRI were included in our study. Fifteen definitions of sustained progression using both the EDSS and the functional system (FS) scales were investigated. The impact of both relapses and changes in provider on the probability of maintaining progression was also evaluated. Although the provider scoring the EDSS sometimes changed during followup, the provider had access to previous EDSS scores. Between 15.8% and 42.2% of patients experienced sustained progression based on the definitions using EDSS as the outcome, but nearly 50% of these patients failed to maintain sustained progression for the duration of followup. When FS scales were used, progression was most common on the pyramidal and sensory scales. Unfortunately, progression on specific FS scales failed to be more sensitive to irreversible disability. Relapses or changes in provider did not explain the poor performance of the measures. Short-term changes in the EDSS or FS scores may not be an accurate marker of irreversible change in RRMS.
Figures


References
-
- Kurtzke JF. Rating neurologic impairment in multiple sclerosis: an expanded disability status scale (EDSS) Neurology. 1983;33(11):1444–1452. - PubMed
-
- Weinshenker BG, Bass B, Rice GPA, et al. The natural history of multiple sclerosis: a geographically based study. I. Clinical course and disability. Brain. 1989;112(1):133–146. - PubMed
-
- Runmarker B, Andersen O. Prognostic factors in a multiple sclerosis incidence cohort with twenty-five years of follow-up. Brain. 1993;116(1):117–134. - PubMed
-
- Lublin FD, Baier M, Cutter G. Effect of relapses on development of residual deficit in multiple sclerosis. Neurology. 2003;61(11):1528–1532. - PubMed
-
- Weiner HL. The challenge of multiple sclerosis: how do we cure a chronic heterogeneous disease? Annals of Neurology. 2009;65(3):239–248. - PubMed
Grants and funding
LinkOut - more resources
Full Text Sources
Other Literature Sources
