

Bursts of vertex activation and epidemics in evolving networks
- PMID: 23555211
- PMCID: PMC3605099
- DOI: 10.1371/journal.pcbi.1002974
Bursts of vertex activation and epidemics in evolving networks
Abstract
The dynamic nature of contact patterns creates diverse temporal structures. In particular, empirical studies have shown that contact patterns follow heterogeneous inter-event time intervals, meaning that periods of high activity are followed by long periods of inactivity. To investigate the impact of these heterogeneities in the spread of infection from a theoretical perspective, we propose a stochastic model to generate temporal networks where vertices make instantaneous contacts following heterogeneous inter-event intervals, and may leave and enter the system. We study how these properties affect the prevalence of an infection and estimate R(0), the number of secondary infections of an infectious individual in a completely susceptible population, by modeling simulated infections (SI and SIR) that co-evolve with the network structure. We find that heterogeneous contact patterns cause earlier and larger epidemics in the SIR model in comparison to homogeneous scenarios for a vast range of parameter values, while smaller epidemics may happen in some combinations of parameters. In the case of SI and heterogeneous patterns, the epidemics develop faster in the earlier stages followed by a slowdown in the asymptotic limit. For increasing vertex turnover rates, heterogeneous patterns generally cause higher prevalence in comparison to homogeneous scenarios with the same average inter-event interval. We find that [Formula: see text] is generally higher for heterogeneous patterns, except for sufficiently large infection duration and transmission probability.
Conflict of interest statement
The authors have declared that no competing interests exist.
Figures
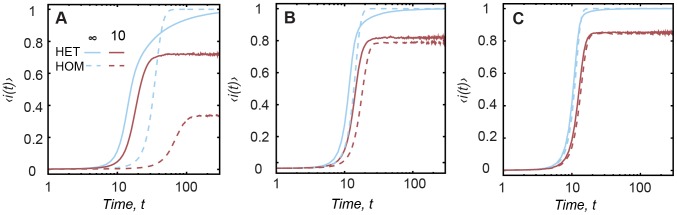
 in case of SI epidemics for HET and HOM contact patterns with
  (blue curves) and
  (red curves). Each column corresponds to a different
  , (A)
, (A)  , (B)
, (B)  and (C)
  . The x-axis is in log-scale.
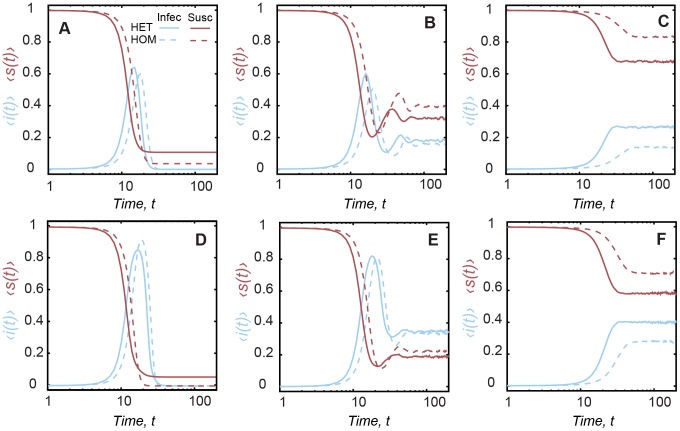
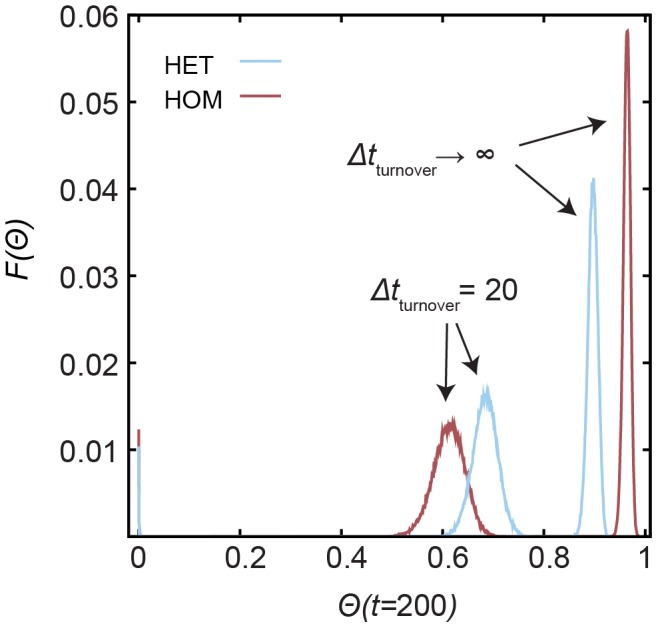
 (i.e. the prevalence – blue) and fraction of susceptible individuals
  (red). Each panel contains a different configuration: (A)
 and
and  ; (B)
; (B)  and
and  ; (C)
; (C)  and
and  ; (D)
; (D)  and
and  ; (E)
; (E)  and
and  ; (F)
; (F)  and
and  . The x-axis is in log-scale.
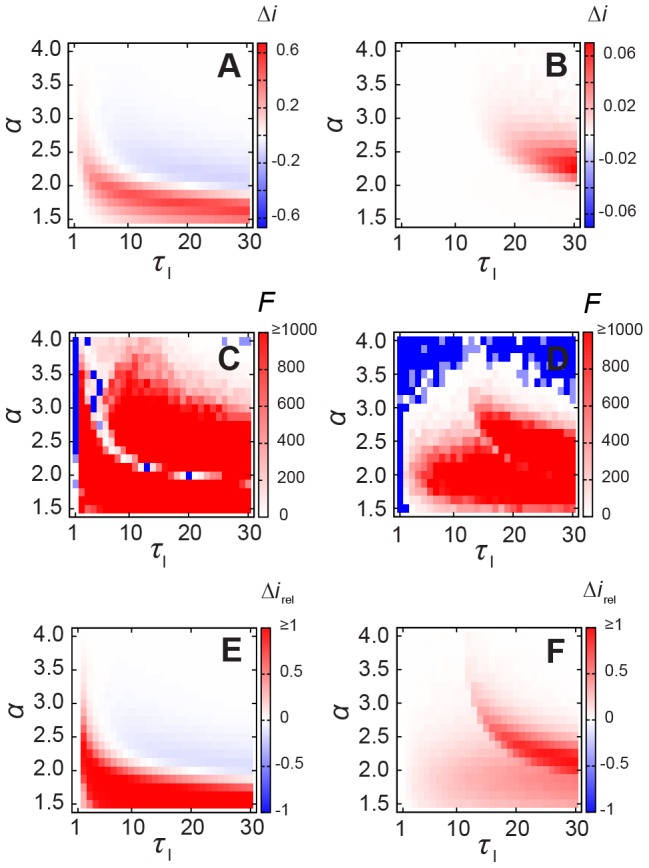
 for (A) deterministic (
 ) and for (B) stochastic (
 ) SIR dynamics with various infective intervals in case of
  . F statistics for (C) deterministic (
 ) and for (D) stochastic (
 ) SIR (red and white mean that HET and HOM peak intensities are statistically different, that is,
  ), raw p-values are in Text S1; the difference relative to the HET case, that is,
  for (E) deterministic (
 ) and for (F) stochastic (
 ) SIR.
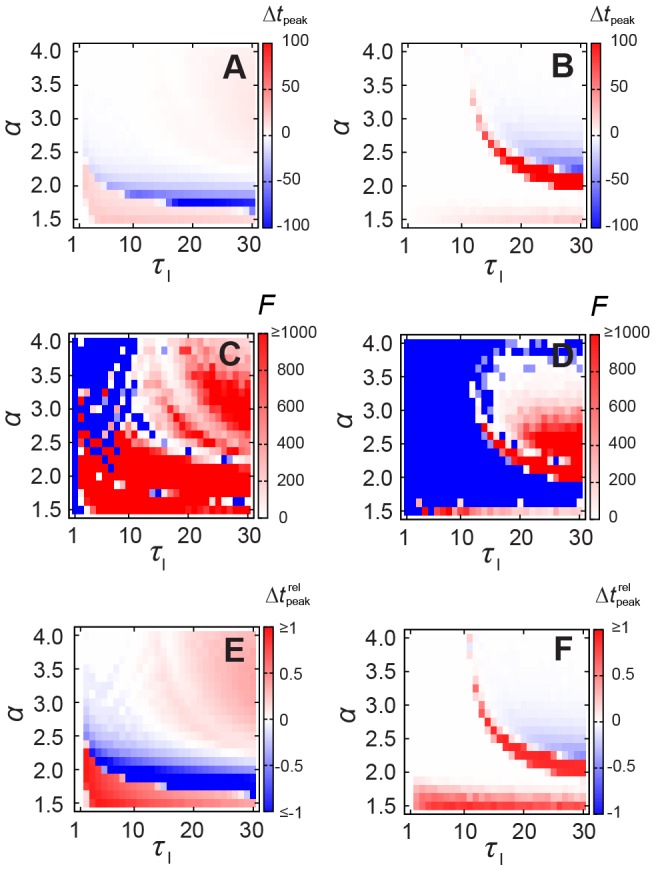
 for (A) deterministic (
 ) and for (B) stochastic (
 ) SIR dynamics with various infective intervals in case of
  ; F statistics for (C) deterministic (
 ) and for (D) stochastic (
 ) SIR (red and white mean that HET and HOM peak times are statistically different, i.e.
  ), raw p-values are in Text S1; the difference relative to the HET case, that is,
  for (E) deterministic (
 ) and for (F) stochastic (
 ) SIR.
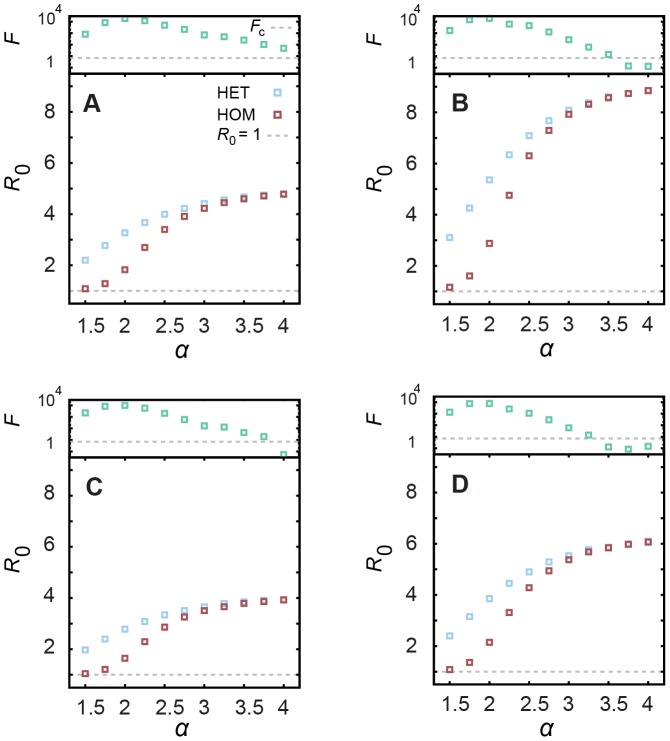
 for SIR in case of (A)
  and (C)
  (with
(with  ), and in case of (B)
  and (D)
  (with
(with  ). The results are independent of the network size
  (see Text S1). Dashed lines correspond to
  . The F statistics is presented above the plots. Dashed lines correspond to
  ;
;  and
and  are statistically different if
  .
.
 for HET network (
 ) and the difference of
  between HET and HOM networks, that is,
  .
.  for HET in case of (A)
  and (E)
  ;
;  for (B)
  and (F)
  ; F statistics for (C)
  and (G)
  (red and white mean that HET and HOM cases are statistically different, that is,
  ); p-values for (D)
  and (H)
  .
.
 an epidemic outbreak with size
  is observed at time
  . The results correspond to the SIR model with
  and network configurations with
  .
.Similar articles
-
Dynamics of stochastic epidemics on heterogeneous networks.J Math Biol. 2014 Jun;68(7):1583-605. doi: 10.1007/s00285-013-0679-1. Epub 2013 Apr 30. J Math Biol. 2014. PMID: 23633042
-
The large graph limit of a stochastic epidemic model on a dynamic multilayer network.J Biol Dyn. 2018 Dec;12(1):746-788. doi: 10.1080/17513758.2018.1515993. J Biol Dyn. 2018. PMID: 30175687
-
A Network Epidemic Model with Preventive Rewiring: Comparative Analysis of the Initial Phase.Bull Math Biol. 2016 Dec;78(12):2427-2454. doi: 10.1007/s11538-016-0227-4. Epub 2016 Oct 31. Bull Math Biol. 2016. PMID: 27800576
-
Modeling epidemics: A primer and Numerus Model Builder implementation.Epidemics. 2018 Dec;25:9-19. doi: 10.1016/j.epidem.2018.06.001. Epub 2018 Jul 13. Epidemics. 2018. PMID: 30017895 Review.
-
SIR epidemics and vaccination on random graphs with clustering.J Math Biol. 2019 Jun;78(7):2369-2398. doi: 10.1007/s00285-019-01347-2. Epub 2019 Apr 10. J Math Biol. 2019. PMID: 30972440 Free PMC article.
Cited by
-
The basic reproduction number as a predictor for epidemic outbreaks in temporal networks.PLoS One. 2015 Mar 20;10(3):e0120567. doi: 10.1371/journal.pone.0120567. eCollection 2015. PLoS One. 2015. PMID: 25793764 Free PMC article.
-
Correlated bursts in temporal networks slow down spreading.Sci Rep. 2018 Oct 17;8(1):15321. doi: 10.1038/s41598-018-33700-8. Sci Rep. 2018. PMID: 30333572 Free PMC article.
-
Epidemic Threshold in Continuous-Time Evolving Networks.Phys Rev Lett. 2018 Feb 9;120(6):068302. doi: 10.1103/PhysRevLett.120.068302. Phys Rev Lett. 2018. PMID: 29481258 Free PMC article.
-
Social fluidity mobilizes contagion in human and animal populations.Elife. 2021 Jul 30;10:e62177. doi: 10.7554/eLife.62177. Elife. 2021. PMID: 34328080 Free PMC article.
-
Recalibrating disease parameters for increasing realism in modeling epidemics in closed settings.BMC Infect Dis. 2016 Nov 14;16(1):676. doi: 10.1186/s12879-016-2003-3. BMC Infect Dis. 2016. PMID: 27842507 Free PMC article.
References
-
- Newman M (2010) Networks: An introduction. USA: Oxford University Press. 720p.
-
- Costa LdaF, Oliveira ON Jr, Travieso G, Rodrigues FA, Villas Boas PR, et al. (2011) Analyzing and modeling real-world phenomena with complex networks: A survey of applications. Adv Phys 60 (3) 329–412.
-
- Pastor-Satorras R, Vespignani A (2001) Epidemic spreading in scale-free networks. Phys Rev Lett 86 (14) 3200–3203. - PubMed
-
- Newman M (2002) Spread of epidemic disease on networks. Phys Rev E 66: 016128. - PubMed
Publication types
MeSH terms
LinkOut - more resources
Full Text Sources
Other Literature Sources
