Network-based survival analysis reveals subnetwork signatures for predicting outcomes of ovarian cancer treatment
- PMID: 23555212
- PMCID: PMC3605061
- DOI: 10.1371/journal.pcbi.1002975
Network-based survival analysis reveals subnetwork signatures for predicting outcomes of ovarian cancer treatment
Abstract
Cox regression is commonly used to predict the outcome by the time to an event of interest and in addition, identify relevant features for survival analysis in cancer genomics. Due to the high-dimensionality of high-throughput genomic data, existing Cox models trained on any particular dataset usually generalize poorly to other independent datasets. In this paper, we propose a network-based Cox regression model called Net-Cox and applied Net-Cox for a large-scale survival analysis across multiple ovarian cancer datasets. Net-Cox integrates gene network information into the Cox's proportional hazard model to explore the co-expression or functional relation among high-dimensional gene expression features in the gene network. Net-Cox was applied to analyze three independent gene expression datasets including the TCGA ovarian cancer dataset and two other public ovarian cancer datasets. Net-Cox with the network information from gene co-expression or functional relations identified highly consistent signature genes across the three datasets, and because of the better generalization across the datasets, Net-Cox also consistently improved the accuracy of survival prediction over the Cox models regularized by L(2) or L(1). This study focused on analyzing the death and recurrence outcomes in the treatment of ovarian carcinoma to identify signature genes that can more reliably predict the events. The signature genes comprise dense protein-protein interaction subnetworks, enriched by extracellular matrix receptors and modulators or by nuclear signaling components downstream of extracellular signal-regulated kinases. In the laboratory validation of the signature genes, a tumor array experiment by protein staining on an independent patient cohort from Mayo Clinic showed that the protein expression of the signature gene FBN1 is a biomarker significantly associated with the early recurrence after 12 months of the treatment in the ovarian cancer patients who are initially sensitive to chemotherapy. Net-Cox toolbox is available at http://compbio.cs.umn.edu/Net-Cox/.
Conflict of interest statement
The authors have declared that no competing interests exist.
Figures

 and the survival information specified by followup times
  and event indicators
  are illustrated on the left. The cost function of Net-Cox given in the box combines the total likelihood of Cox regression with a network regularization. The gene network shown is used as a constraint to encourage smoothness among correlated genes, i.e. the coefficients of the genes connected with edges of large weights are similarly weighted.

 and
and  . The fifth column of plots compare the time-dependent area under the ROC curves based on the estimated risk scores (PIs). The plots show the results for the death outcome by training with TCGA dataset and test on Tothill Dataset (A), the death outcome by training with TCGA dataset and test on Bonome Dataset (B), the tumor recurrence outcome by training with TCGA dataset and test on Tothill Dataset (C).

 was fixed and
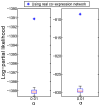
  is set to allow better evaluation of the network information. The log-partial likelihood computed by Net-Cox on the real co-expression network and on the randomized co-expression network are reported against tumor recurrence in the TCGA and Tothill datasets. The stars represent the results with the real co-expression networks, and the boxplots represent the results with the randomized networks.
 was fixed and
  is varied from
  to
to  . The CVPL of five-fold cross-validation on the real co-expression network and on the randomized co-expression network are reported against tumor recurrence in TCGA dataset (A) and Tothill dataset (B). The stars represent the results with the real co-expression networks, and the boxplots represent the results with the randomized networks.


Similar articles
-
AID/APOBEC-network reconstruction identifies pathways associated with survival in ovarian cancer.BMC Genomics. 2016 Aug 16;17(1):643. doi: 10.1186/s12864-016-3001-y. BMC Genomics. 2016. PMID: 27527602 Free PMC article.
-
Identification of pathway-based recurrence-associated signatures in optimally debulked patients with serous ovarian cancer.J Cell Biochem. 2018 Nov;119(10):8564-8573. doi: 10.1002/jcb.27098. Epub 2018 Aug 20. J Cell Biochem. 2018. PMID: 30126000
-
Identifying prognostic signature in ovarian cancer using DirGenerank.Oncotarget. 2017 Jul 11;8(28):46398-46413. doi: 10.18632/oncotarget.18189. Oncotarget. 2017. PMID: 28615526 Free PMC article.
-
Ovarian cancer: genomic analysis.Ann Oncol. 2013 Dec;24 Suppl 10(Suppl 10):x7-15. doi: 10.1093/annonc/mdt462. Ann Oncol. 2013. PMID: 24265410 Free PMC article. Review.
-
Inferring Aberrant Signal Transduction Pathways in Ovarian Cancer from TCGA Data.Cancer Inform. 2014 Oct 13;13(Suppl 1):29-36. doi: 10.4137/CIN.S13881. eCollection 2014. Cancer Inform. 2014. PMID: 25392681 Free PMC article. Review.
Cited by
-
Integrating spatial transcriptomics and bulk RNA-seq: predicting gene expression with enhanced resolution through graph attention networks.Brief Bioinform. 2024 May 23;25(4):bbae316. doi: 10.1093/bib/bbae316. Brief Bioinform. 2024. PMID: 38960406 Free PMC article.
-
Twiner: correlation-based regularization for identifying common cancer gene signatures.BMC Bioinformatics. 2019 Jun 25;20(1):356. doi: 10.1186/s12859-019-2937-8. BMC Bioinformatics. 2019. PMID: 31238876 Free PMC article.
-
Survival analysis tools in genomics research.Hum Genomics. 2014 Nov 25;8(1):21. doi: 10.1186/s40246-014-0021-z. Hum Genomics. 2014. PMID: 25421963 Free PMC article. Review.
-
Periostin in tumor microenvironment is associated with poor prognosis and platinum resistance in epithelial ovarian carcinoma.Oncotarget. 2016 Jan 26;7(4):4036-47. doi: 10.18632/oncotarget.6700. Oncotarget. 2016. PMID: 26716408 Free PMC article.
-
Incorporating genetic networks into case-control association studies with high-dimensional DNA methylation data.BMC Bioinformatics. 2019 Oct 22;20(1):510. doi: 10.1186/s12859-019-3040-x. BMC Bioinformatics. 2019. PMID: 31640538 Free PMC article.
References
-
- Rosenwald A, Wright G, Chan WC, Connors JM, Campo E, et al. (2002) The use of molecular profiling to predict survival after chemotherapy for diffuse large-b-cell lymphoma. New England Journal of Medicine 346: 1937–1947. - PubMed
-
- Bøvelstad HM, Nygård S, Størvold HL, Aldrin M, Borgan Ø, et al. (2007) Predicting survival from microarray data-a comparative study. Bioinformatics 23: 2080–2087. - PubMed
-
- Van Wieringen W, Kun D, Hampel R, Boulesteix A (2009) Survival prediction using gene expression data: a review and comparison. Computational statistics & data analysis 53: 1590–1603.
Publication types
MeSH terms
Substances
Grants and funding
LinkOut - more resources
Full Text Sources
Other Literature Sources
Medical

