Automated analysis of a diverse synapse population
- PMID: 23555213
- PMCID: PMC3610606
- DOI: 10.1371/journal.pcbi.1002976
Automated analysis of a diverse synapse population
Abstract
Synapses of the mammalian central nervous system are highly diverse in function and molecular composition. Synapse diversity per se may be critical to brain function, since memory and homeostatic mechanisms are thought to be rooted primarily in activity-dependent plastic changes in specific subsets of individual synapses. Unfortunately, the measurement of synapse diversity has been restricted by the limitations of methods capable of measuring synapse properties at the level of individual synapses. Array tomography is a new high-resolution, high-throughput proteomic imaging method that has the potential to advance the measurement of unit-level synapse diversity across large and diverse synapse populations. Here we present an automated feature extraction and classification algorithm designed to quantify synapses from high-dimensional array tomographic data too voluminous for manual analysis. We demonstrate the use of this method to quantify laminar distributions of synapses in mouse somatosensory cortex and validate the classification process by detecting the presence of known but uncommon proteomic profiles. Such classification and quantification will be highly useful in identifying specific subpopulations of synapses exhibiting plasticity in response to perturbations from the environment or the sensory periphery.
Conflict of interest statement
The authors have declared that no competing interests exist.
Figures

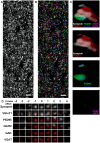
 . (B) Randomly-colored segmentation of individual synapsin puncta. (C) Rendering of a single punctum from the volume showing synapsin (white), imaged together with VGluT1 (red), PSD95 (green), GluR2 (blue), GAD (magenta) and VGAT (magenta). From top to bottom: all proteomic markers, glutamatergic presynaptic labels, glutamatergic postsynaptic labels, GABAergic labels. This appears to be a glutamatergic synapse. (D) The synaptogram derived from the same synapse. Synapsin, top row, is repeated in red for the rest to provide spatial context. Not shown, sixteen other colors and two redundant labels (synapsin and VGluT1). Scale bar: 5
  , size of synaptogram/render volume, 1100 nm × 1100 nm × 630 nm.


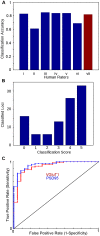
 PSD95), trained by human rater i, performed comparably to the humans. (B) Rater agreement histogram. 100 individually-classified synaptic loci are scored according to the number of “yes” votes received among the five humans composing the gold standard consensus. Situations with unanimous agreement (0,5) make up half of the set (49 loci), with an additional 37 examples having only one dissenting opinion (1,4). (C) Receiver operating characteristics (ROC) curve, for VGluT1 and PSD95 classifications on human-rated data. The ROC curve describes the tradeoff between reducing false positives (left side of the curve) and maximizing true positives (right side of the curve). The displayed diagonal line represents chance, with better classifiers occupying large areas between the diagonal and their own curves.
 0.05).
 . Red squares represent label pairs which are copresent more than expected, blue squares less than expected by chance. * - GABAergic markers are copresent with each other, but avoid glutamatergic and TH markers. ? - VGluT1/2 are copresent with PSD95, but not with each other. # - VGluT3 is present with all three GABAergic markers, but avoids VGluT1 and PSD95. & - VGluT2 shows some presence with TH. ∼ - TH tends to avoid VAChT.
References
-
- Grant S (2007) Toward a molecular catalogue of synapses. Brain research reviews 55: 445–9. - PubMed
-
- Sheng M, Hoogenraad C (2007) The postsynaptic architecture of excitatory synapses: a more quantitative view. Annual review of biochemistry 76: 823–47. - PubMed
-
- Lein E, Hawrylycz M, Ao N, Ayres M, Bensinger A, et al. (2007) Genome-wide atlas of gene expression in the adult mouse brain. Nature 445: 168–76. - PubMed
Publication types
MeSH terms
Substances
Grants and funding
LinkOut - more resources
Full Text Sources
Other Literature Sources

