

Sustained firing of model central auditory neurons yields a discriminative spectro-temporal representation for natural sounds
- PMID: 23555217
- PMCID: PMC3610626
- DOI: 10.1371/journal.pcbi.1002982
Sustained firing of model central auditory neurons yields a discriminative spectro-temporal representation for natural sounds
Abstract
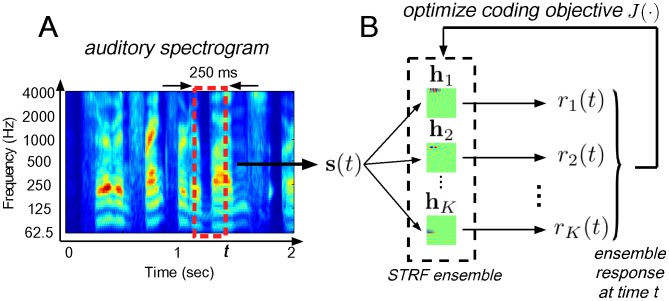
The processing characteristics of neurons in the central auditory system are directly shaped by and reflect the statistics of natural acoustic environments, but the principles that govern the relationship between natural sound ensembles and observed responses in neurophysiological studies remain unclear. In particular, accumulating evidence suggests the presence of a code based on sustained neural firing rates, where central auditory neurons exhibit strong, persistent responses to their preferred stimuli. Such a strategy can indicate the presence of ongoing sounds, is involved in parsing complex auditory scenes, and may play a role in matching neural dynamics to varying time scales in acoustic signals. In this paper, we describe a computational framework for exploring the influence of a code based on sustained firing rates on the shape of the spectro-temporal receptive field (STRF), a linear kernel that maps a spectro-temporal acoustic stimulus to the instantaneous firing rate of a central auditory neuron. We demonstrate the emergence of richly structured STRFs that capture the structure of natural sounds over a wide range of timescales, and show how the emergent ensembles resemble those commonly reported in physiological studies. Furthermore, we compare ensembles that optimize a sustained firing code with one that optimizes a sparse code, another widely considered coding strategy, and suggest how the resulting population responses are not mutually exclusive. Finally, we demonstrate how the emergent ensembles contour the high-energy spectro-temporal modulations of natural sounds, forming a discriminative representation that captures the full range of modulation statistics that characterize natural sound ensembles. These findings have direct implications for our understanding of how sensory systems encode the informative components of natural stimuli and potentially facilitate multi-sensory integration.
Conflict of interest statement
The authors have declared that no competing interests exist.
Figures
 for
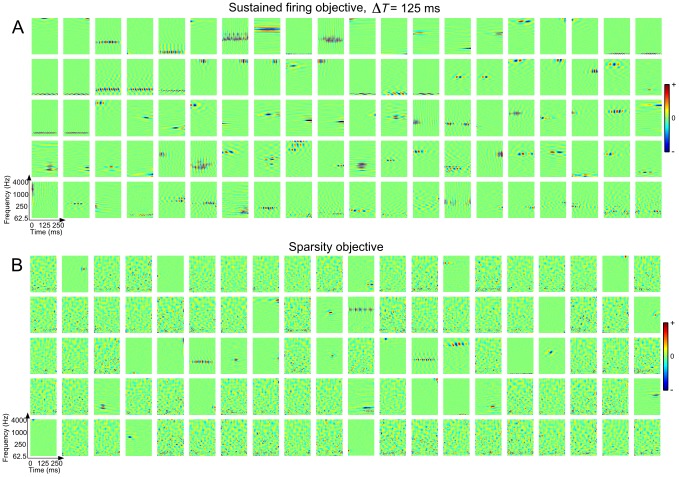
for  and (B) the sparsity objective function
  . The examples shown here were drawn at random from ensembles of 400 neurons. The sustained STRFs are shown in order of decreasing contribution to the overall objective function whereas the sparse STRFs are shown randomly ordered. Each spectro-temporal patch spans 0–250 ms in time and 62.5–4000 Hz in frequency. For these examples the dynamic range of the STRFs was compressed using a
  nonlinearity.
 10, 25, 50, 125, 250, 500, 1000, and 2500 ms. Shown in the center is a stacked bar chart where segment color corresponds to class label and segment width is proportional to the number of STRFs assigned to a particular class in a given ensemble. The surrounding panels show examples of STRFs drawn from six illustrative classes, namely, noisy, localized, spectral, complex, temporal, and directional.
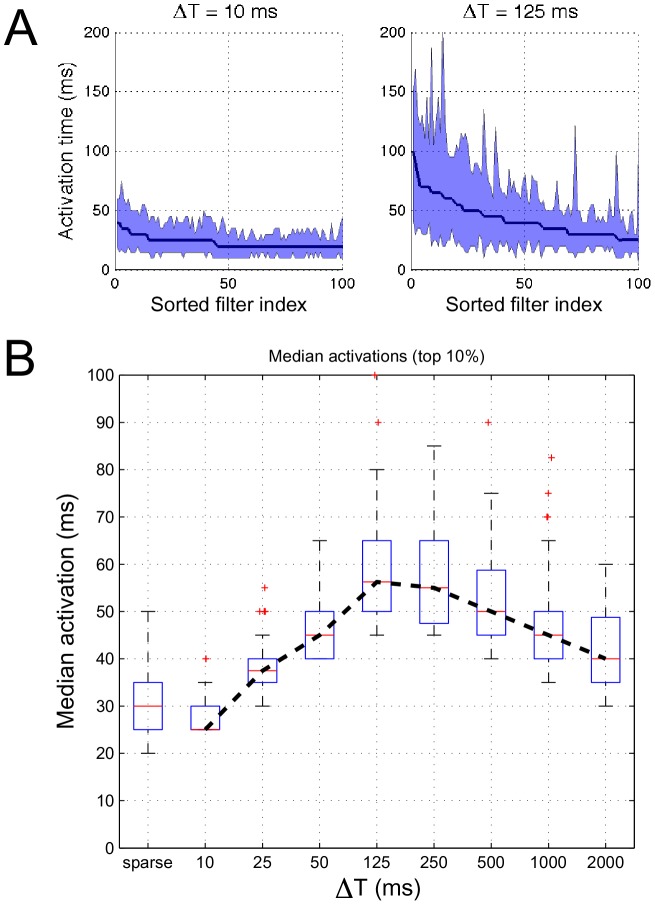
 10 and 125 ms, respectively, for STRFs that optimize the sustained objective function. The shaded region illustrates the corresponding interquartile range. Panel (B) shows the distributions (as boxplots) of median activation times of the top 10% “most persistent” neurons for sparse and sustained ensembles for increasing
  .
.
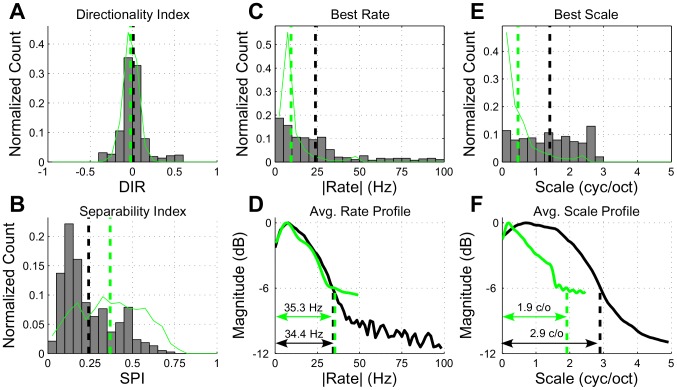
 . In panels (A), (B), (C) and (E), the histograms show the distribution of model parameters whereas the thin green lines show the distribution of the physiological data. The black and green dashed vertical lines show population means for the model and neural data, respectively. In panels (D) and (F), the black and green lines correspond to the model and neural STRFs, respectively, with the dashed lines indicating 6-dB upper cutoff frequencies. Refer to the text for more details.

 nonlinearity.
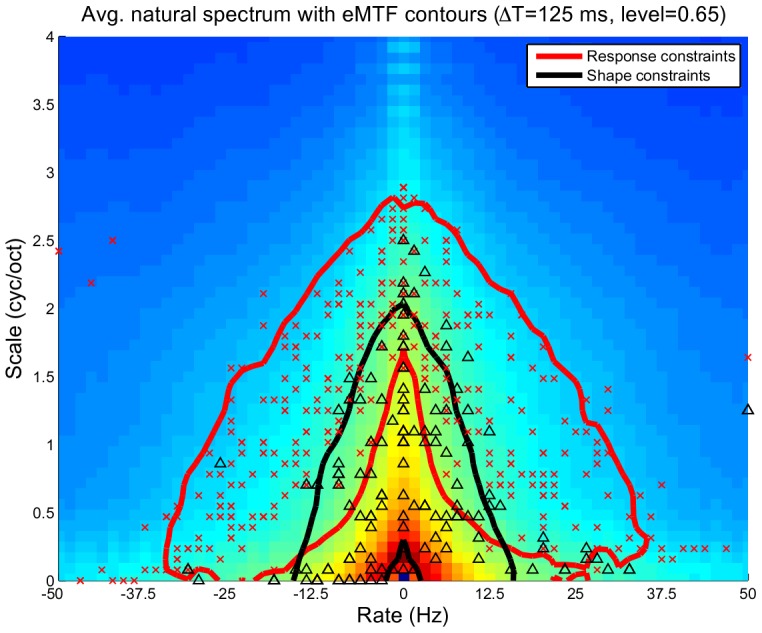
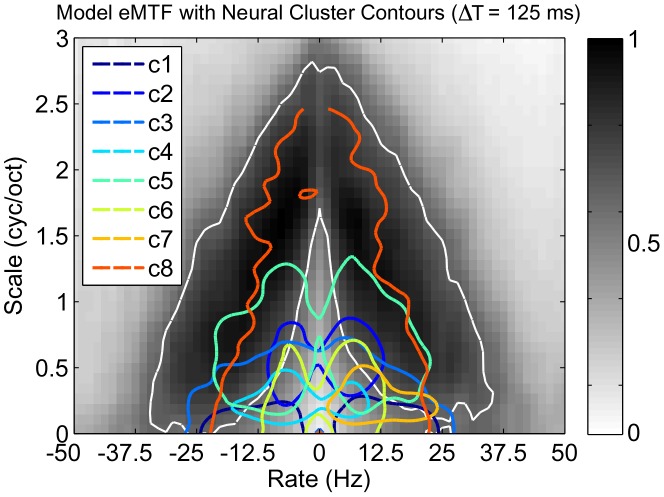
 . For each ensemble we also show the constellations for best rate vs. best scale (marked by ‘
 ’ and ‘
 ’ for response and shape constraints, respectively). For the response constraints, we show the contour line and BR/BS constellations for STRFs that contribute to 99% of the objective function.
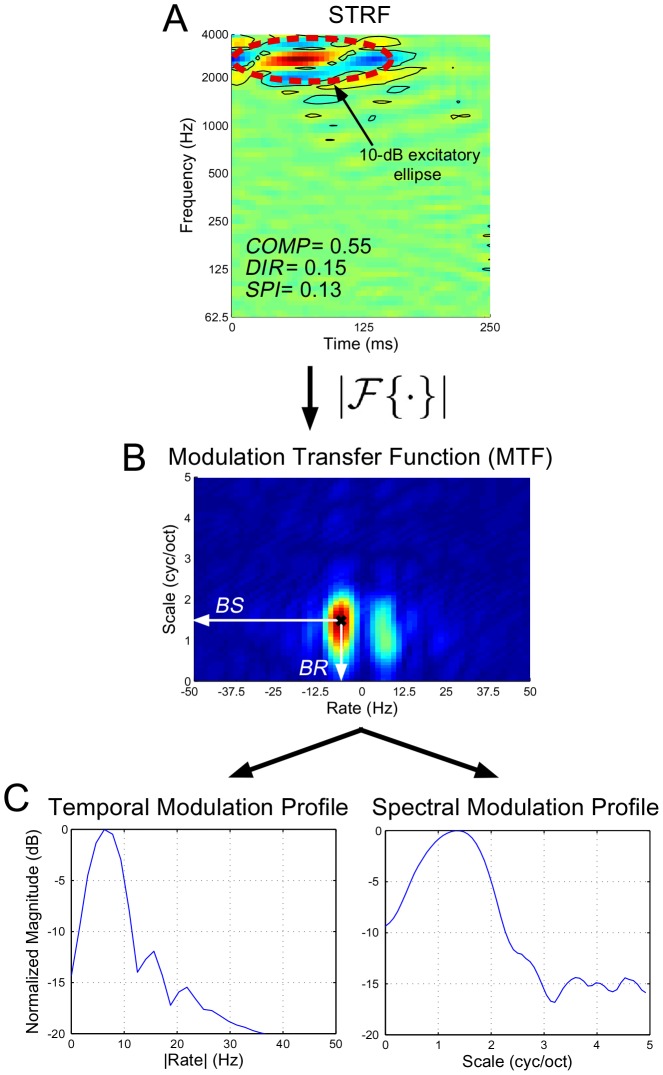
 one standard deviation. The dashed red line shows the projected 10-dB ellipse from which we estimated spectral bandwidth. As indicated, the STRF is rather elongated with no strong directional preference, and the pattern is highly separable. Panel (B) shows the MTF computed from the magnitude of the 2D Fourier Transform of the STRF in (A); from here we estimate
  and
and  . Panel (C) shows the normalized temporal and spectral modulation profiles obtained from the MTF.
Similar articles
-
Spectral-temporal receptive fields of nonlinear auditory neurons obtained using natural sounds.J Neurosci. 2000 Mar 15;20(6):2315-31. doi: 10.1523/JNEUROSCI.20-06-02315.2000. J Neurosci. 2000. PMID: 10704507 Free PMC article.
-
How do auditory cortex neurons represent communication sounds?Hear Res. 2013 Nov;305:102-12. doi: 10.1016/j.heares.2013.03.011. Epub 2013 Apr 17. Hear Res. 2013. PMID: 23603138 Review.
-
Tuning for spectro-temporal modulations as a mechanism for auditory discrimination of natural sounds.Nat Neurosci. 2005 Oct;8(10):1371-9. doi: 10.1038/nn1536. Epub 2005 Sep 4. Nat Neurosci. 2005. PMID: 16136039
-
Rapid synaptic depression explains nonlinear modulation of spectro-temporal tuning in primary auditory cortex by natural stimuli.J Neurosci. 2009 Mar 18;29(11):3374-86. doi: 10.1523/JNEUROSCI.5249-08.2009. J Neurosci. 2009. PMID: 19295144 Free PMC article.
-
Context dependence of spectro-temporal receptive fields with implications for neural coding.Hear Res. 2011 Jan;271(1-2):123-32. doi: 10.1016/j.heares.2010.01.014. Epub 2010 Feb 1. Hear Res. 2011. PMID: 20123121 Review.
Cited by
-
Modeling attention-driven plasticity in auditory cortical receptive fields.Front Comput Neurosci. 2015 Aug 19;9:106. doi: 10.3389/fncom.2015.00106. eCollection 2015. Front Comput Neurosci. 2015. PMID: 26347643 Free PMC article.
-
Sensory cortex is optimized for prediction of future input.Elife. 2018 Jun 18;7:e31557. doi: 10.7554/eLife.31557. Elife. 2018. PMID: 29911971 Free PMC article.
-
STRFs in primary auditory cortex emerge from masking-based statistics of natural sounds.PLoS Comput Biol. 2019 Jan 17;15(1):e1006595. doi: 10.1371/journal.pcbi.1006595. eCollection 2019 Jan. PLoS Comput Biol. 2019. PMID: 30653497 Free PMC article.
-
Auditory and visual scene analysis: an overview.Philos Trans R Soc Lond B Biol Sci. 2017 Feb 19;372(1714):20160099. doi: 10.1098/rstb.2016.0099. Epub 2017 Jan 2. Philos Trans R Soc Lond B Biol Sci. 2017. PMID: 28044011 Free PMC article.
-
A Framework for Speech Activity Detection Using Adaptive Auditory Receptive Fields.IEEE/ACM Trans Audio Speech Lang Process. 2015 Dec;23(12):2422-2433. doi: 10.1109/TASLP.2015.2481179. Epub 2015 Sep 23. IEEE/ACM Trans Audio Speech Lang Process. 2015. PMID: 29904642 Free PMC article.
References
-
- Simoncelli EP, Olshausen BA (2001) Natural image statistics and neural representation. Annu Rev Neurosci 24: 1193–1216. - PubMed
-
- Olshausen BA, Field DJ (2004) Sparse coding of sensory inputs. Curr Op Neurobio 14: 481–487. - PubMed
-
- Rosenblith WA, editor (1961) Sensory Communication. Cambridge (Massachusetts): MIT Press.
-
- Laughlin SB (2001) Energy as a constraint on the coding and processing of sensory information. Curr Op Neurobio 11: 475–480. - PubMed
-
- Olshausen BA, Field DJ (1996) Emergence of simple-cell receptive field properties by learning a sparse code for natural images. Nature 381: 607–609. - PubMed
Publication types
MeSH terms
Grants and funding
LinkOut - more resources
Full Text Sources
Other Literature Sources
