

Outlier responses reflect sensitivity to statistical structure in the human brain
- PMID: 23555230
- PMCID: PMC3610625
- DOI: 10.1371/journal.pcbi.1002999
Outlier responses reflect sensitivity to statistical structure in the human brain
Abstract
We constantly look for patterns in the environment that allow us to learn its key regularities. These regularities are fundamental in enabling us to make predictions about what is likely to happen next. The physiological study of regularity extraction has focused primarily on repetitive sequence-based rules within the sensory environment, or on stimulus-outcome associations in the context of reward-based decision-making. Here we ask whether we implicitly encode non-sequential stochastic regularities, and detect violations therein. We addressed this question using a novel experimental design and both behavioural and magnetoencephalographic (MEG) metrics associated with responses to pure-tone sounds with frequencies sampled from a Gaussian distribution. We observed that sounds in the tail of the distribution evoked a larger response than those that fell at the centre. This response resembled the mismatch negativity (MMN) evoked by surprising or unlikely events in traditional oddball paradigms. Crucially, responses to physically identical outliers were greater when the distribution was narrower. These results show that humans implicitly keep track of the uncertainty induced by apparently random distributions of sensory events. Source reconstruction suggested that the statistical-context-sensitive responses arose in a temporo-parietal network, areas that have been associated with attention orientation to unexpected events. Our results demonstrate a very early neurophysiological marker of the brain's ability to implicitly encode complex statistical structure in the environment. We suggest that this sensitivity provides a computational basis for our ability to make perceptual inferences in noisy environments and to make decisions in an uncertain world.
Conflict of interest statement
The authors have declared that no competing interests exist.
Figures
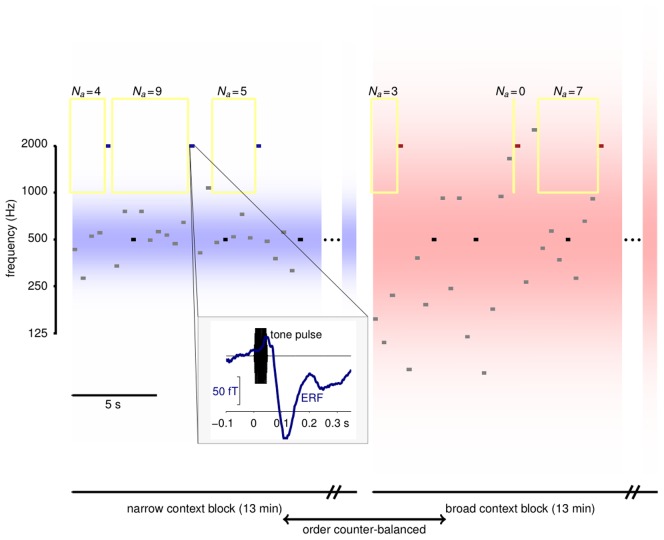
 give the number of preceding tones that fell outside the adaptation window. Block lengths are indicated for Experiment 2. Blocks in Experiment 1 were shorter and repeated more often. Inset: The timing of tones and MEG epochs. Tone pulse waveforms (black) lasted 50 ms with ramped onsets and offsets. MEG responses (blue) were extracted from 100 ms before to 350 ms after tone onset. The evoked response shown is the average response to odd probes in the narrow context, spatially filtered as in Figure 5.
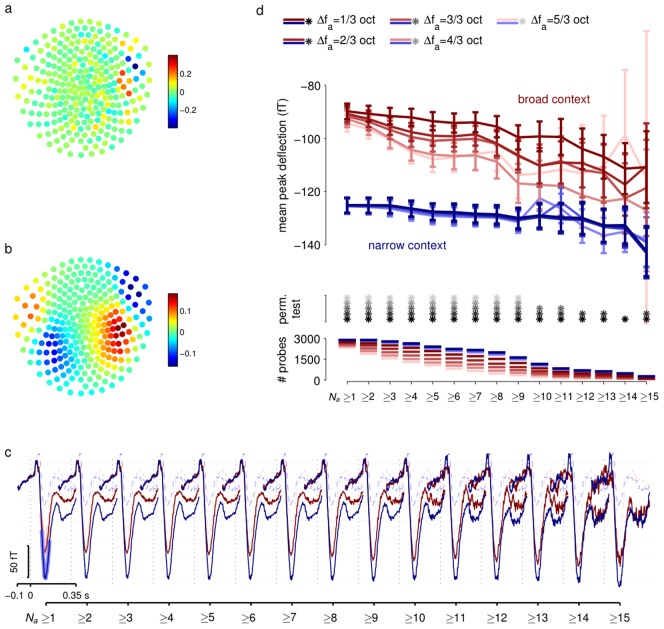
 , here 1/3 octave). ERFs are separated by context (blue narrow; red broad). Shading for
  curves show regions averaged to obtain peak values in (d). Adaptation is evident for odd probes in the broad context but small or absent in the narrow context. ERFs for standard probes (dashed lines) are also shown for reference, and are not grouped by Na. (d) Adaptation effects for a range of windows. Curves show ERF peaks (averaged as indicated in (c)) for odd probes in narrow (blue) and broad (red) context as a function of threshold value of Na, calculated for different frequency exclusion windows (colour saturation, see legend at top). Error bars show standard errors. Grey stars indicate pairs of ERFs that were significantly different at the p<0.05 level according to a random permutation test. Lines at the bottom show the number of probe tones (combined across all subjects) that contribute to each ERF. Numbers fall as threshold Na grows, contributing to greater uncertainty in measurements.
References
-
- Mumford D (1991) On the computational architecture of the neocortex. I. The role of the thalamo-cortical loop. Biol Cybern 65: 135–145. - PubMed
-
- Mumford D (1992) On the computational architecture of the neocortex. II. The role of cortico-cortical loops. Biol Cybern 66: 241–251. - PubMed
-
- Rao RP, Ballard DH (1999) Predictive coding in the visual cortex: a functional interpretation of some extra-classical receptive-field effects. Nat Neurosci 2: 79–87. - PubMed
-
- Yuille A, Kersten D (2006) Vision as Bayesian inference: analysis by synthesis? Trends Cogn Sci 10: 301–308. - PubMed
Publication types
MeSH terms
Grants and funding
LinkOut - more resources
Full Text Sources
Other Literature Sources
